How to use a Catchr Looker Studio template
Learn how to use a Catchr Looker Studio template, connect your data, customize your dashboard, fix common issues, and build reports in minutes.
Catchr Looker Studio templates are built to help you launch powerful dashboards in minutes. Instead of building everything manually, you plug your data into a structure designed around real marketing needs. Here’s how to go from the public template preview to your fully connected, fully editable report, smoothly and without confusion.
Step-by-step tutorial
1. Opening the template
Click “Get this template” to open the dashboard preview in Looker Studio.
.gif)
2. Adding your data to the template
Click “Use my own data” to create your personal version of the template.
Right after that, Looker Studio will prompt you to select or create a data source that matches the Catchr connector used in the template (Google Ads, Meta Ads, TikTok Ads, GA4, etc.).
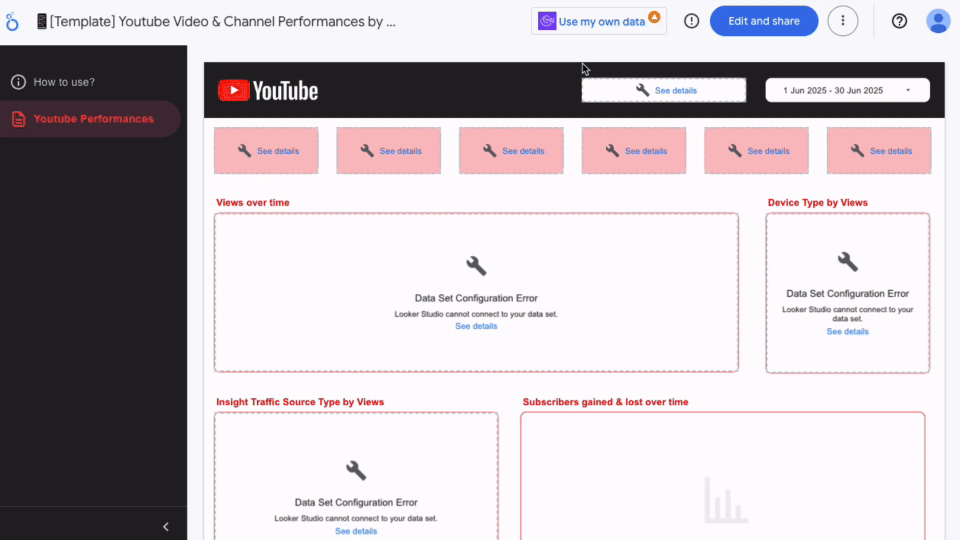
Once you’ve added all necessary data sources, each linked to the correct Catchr connector, the template will refresh automatically and load your real data. You can then move on to the next step.
3. Choose your account
Select the account(s) you want, one or multiple, then click the "Add" button.
.gif)
Once everything is mapped, the dashboard updates automatically with your real metrics. As soon as you finish linking everything, Looker Studio refreshes the report and loads your real data.
4. Finalizing the report
After all your data sources are connected, click “Edit and share”.
This confirms that the template now belongs to you and allows you to manage access settings if you're collaborating with others.
Then click “Edit” to enter editing mode and unlock full customization features.
.gif)
5. Customize your report
Once in Edit mode, you have complete freedom to customize the dashboard.
You can rename it, manage who can view or edit it, and organize permissions, especially useful if you collaborate with teammates or clients.
- adjust the visuals (colors, layout, fonts, logos)
- reorganize the structure (pages, headers, navigation)
- refine the data (metrics, filters, custom formulas)
.gif)
Everything you edit affects only your personal version, the public template remains untouched.
For deeper customizations, Looker Studio’s fields and calculated fields let you create your own KPIs and adapt the dashboard to your business needs.
6. Where to find your report later
Once saved, your customized version appears directly on your Looker Studio homepage, alongside your other reports. You can:
- find it by name,
- access it from the “Reports” section,
- or bookmark it for quick access.
Even if you close your browser or switch devices, the report stays available in your Google account.
.png)
Common issues and why they happen
If something looks incorrect in your report, start by reviewing your data sources under Resource → Manage added data sources. Most issues come from:
- a missing or incorrect connection
- selecting the wrong account
- an empty date range
- metrics that aren’t available for the selected campaigns
If you think you made a mistake during setup, you can simply restart the process from the beginning by clicking Get this template again and reconnecting your data sources.
FAQ
How do I authenticate my data sources?
Click Authenticate when prompted and follow the authorization steps for each platform used in the template. Make sure all required accounts are properly connected so the dashboard can load your data.
What if I selected the wrong data source by mistake?
If you connected the wrong account or chose an incorrect data source, you can easily fix it in Looker Studio by using the options to change data sources or delete incorrect sources. Once corrected, reconnect the right Catchr source and refresh your report. You can also restart the setup from the beginning and choose the correct data source.
How to save my changes in a Looker Studio report?
Once you have click on Edit and share after adding your data source, your changes are automatically save.
Conclusion
A Catchr Looker Studio template isn’t just a shortcut, it’s a framework that gives you an immediate, reliable structure for analyzing your marketing performance. Once you understand the onboarding flow (preview, connect, edit), the entire setup becomes seamless. You can pick the layout that suits your needs from the Looker Studio templates library, test everything during the 14-day trial, and decide whether to subscribe to keep your data syncing automatically
In a few minutes, you move from a generic public template to a tailored dashboard powered by your own data, ready to share with your team and adapt as your reporting needs evolve. The real value comes afterward: you spend less time building reports and more time interpreting them, optimizing performance, and making better decisions.

