Filters in Data Studio
Learn how to create and apply filters in Data Studio (formerly Looker Studio). Discover the different filter types, how to set them up step by step, and best practices to refine your data analysis and reports.
All data does not serve the same purpose. In some cases, you’ll need to refine your analysis more precisely, isolating a specific segment or excluding values that add no meaningful insight. To do this, Data Studio allows you to create your own filters, in addition to the standard controls built into the tool.
What is a filter in Data Studio?
A filter in Data Studio (formerly Looker Studio) is a setting that determines which data is displayed (or not) in your charts, tables, and reports. You can create and apply multiple filters within the same report.
Do not confuse filters with controls in Data Studio. While a filter is static, a control is a dynamic element that can be used by a viewer. Filters, on the other hand, can only be created and configured in edit mode.
How to create a filter in Data Studio
1. Open the filter editor
- From the top menu: Resources > Manage Filters > Add a filter
- Or directly from a visualization in your report: Add filter
2. Define the filter conditions
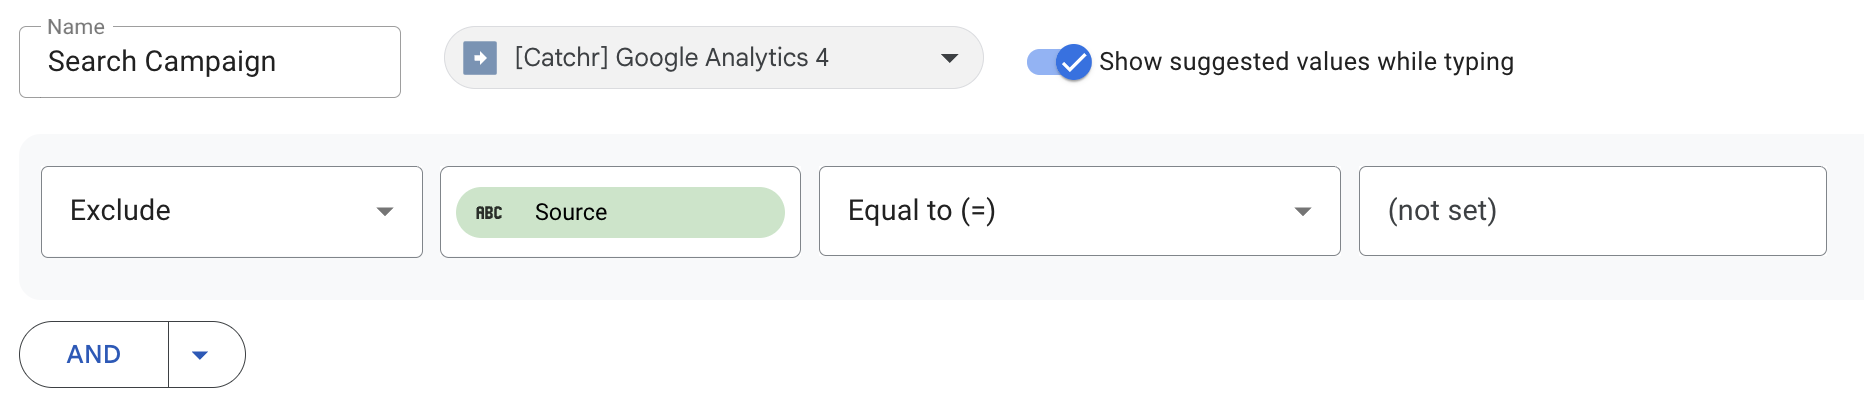
Choose your filter name, the relevant data source, whether to include or exclude values, and which field to apply it to. You can select multiple fields and combine them using the logical connectors AND and OR. If you choose “AND”, all conditions must be met; if you choose “OR”, only one of your conditions needs to be met.
Examples of filters:
- Display only campaigns that start with “SEARCH.”

- Exclude “(not set)” values from the Source dimension.
Once you’ve defined your conditions, save your filter.
How to add a filter in Date Studio
There are three ways to apply a filter in Data Studio.
At the report level
If you apply a filter at the report level, it will affect all pages and all visualizations.
- Click File > Report Settings
- In the right panel, click Add filter
- Choose your filter
At the page level
The filter will apply only to the selected page.
- Click Page > Current Page Settings
- In the right panel, click Add filter
- Choose your filter

At the chart level
Finally, you can add a filter directly to a chart or component.
- Select the component
- In the right panel, under the Filter section, click Add filter
- Choose your filter
Calculated fields and filters
Calculated fields are custom fields that you create in Data Studio from existing data. They allow you to prepare or transform your data before applying filters.
Example: you want to filter campaigns whose names contain “Search” or “SEA,” but the naming isn’t consistent (for example, “search_fr,” “Search_UK,” or “SEA-CAMP”). You can create a calculated field, using REGEX, called Campaign Channel:
CASE
    WHEN REGEXP_MATCH(Campaign, "(?i)(search|sea)") THEN "SEA"
    ELSE "Other"
END
Then, create a filter that includes only rows where Campaign Channel = SEA.
Why combine filters and calculated fields?
- To standardize data before filtering.
- To create custom groupings (by region, channel, campaign type, etc.).
- To eliminate noisy or inconsistent values (tracking errors, mislabeled data).
This approach is powerful: instead of building complex filters with multiple conditions, you clean your data once with a calculated field, then filter on that simplified output.
Best practices
Creating filters in Data Studio is simple, but managing them can quickly become complex if you have multiple conditions and data sources. Here are some best practices to keep your reports efficient and easy to maintain.
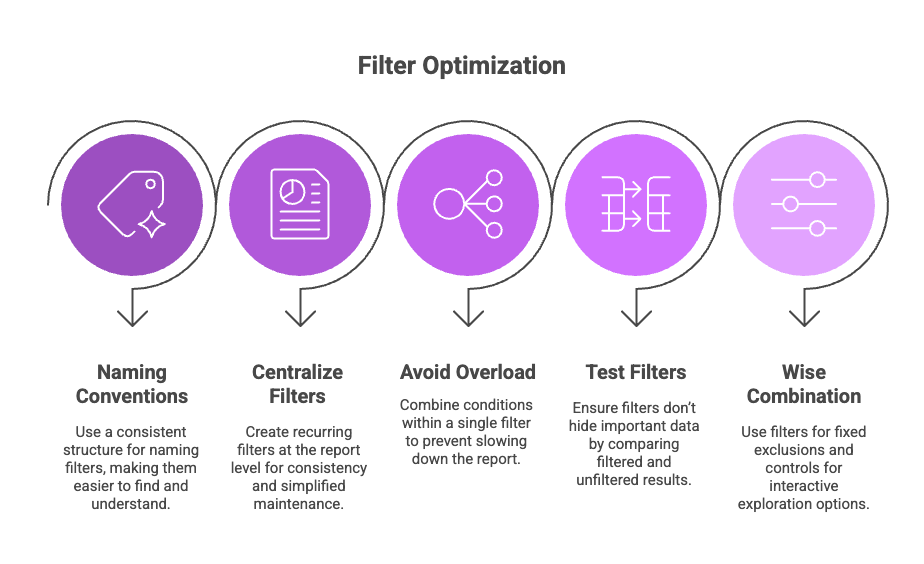
Use clear naming conventions
Adopt a consistent structure for naming filters.
For examples:
- Include – Source – Google Ads
- Exclude – Country – France
- Include – Campaign – SEARCH
This makes filters easier to find and understand at a glance in the Manage Filters list.
Centralize recurring filters
If you often use the same filters (for example, excluding “(not set)” or filtering out test data), create them at the report level instead of per chart. This ensures consistency across pages and simplifies maintenance.
Avoid filter overload
Adding too many filters can slow down your report. Combine multiple conditions within a single filter using AND / OR instead of stacking separate filters.
Test your filters
Make sure your filters don’t accidentally hide important data. Temporarily switch to Include All mode to compare filtered vs. unfiltered results.
Combine filters and controls wisely
Filters are best for fixed exclusions (irrelevant values, internal traffic, etc.), while controls (drop-down menus, checkboxes, date sliders) give viewers interactive exploration options. Plan your filtering strategy early in your report design process.
Common errors in Data Studio
- Missing or renamed field: the field used in the filter no longer exists in the data source and must be updated.
- Incompatible data type: the filter condition doesn’t match the field type (text, number, or date).
- Filter applied to the wrong source: the visualization and the filter use different data sources.
- Case or spacing sensitivity: “Search” and “search” are treated as different values.
- Conflicting filters: two filters exclude or override each other on the same field (for example, “Include France” and “Exclude Europe”).
- Incorrect filter level: the filter is applied at the wrong level (report, page, or chart).
- Invalid calculated field: a syntax error or missing field causes the filter to fail.
- Disconnected or expired source: the connector has lost access to the data source.
Conclusion
Filters in Data Studio (formerly Looker Studio) are powerful tools to refine your analysis, clean your data, and make your reports more insightful. By combining them with dynamic controls and calculated fields, you offer users a smoother and more customized data exploration experience. Used effectively, filters become an essential part of your reporting strategy, improving both the quality of insights and the overall performance of your dashboards.

