Home > Destinations > Claude > Google Analytics

Connect Google Analytics to Claude

Connect Google Analytics to Claude and ask about any metrics or dimensions using current integrations data. No CSV exports or manual campaign summaries.

Looker Studio
Power BI
Google Sheets
BigQuery
Snowflake

Trusted by marketing teams that talk to data everyday

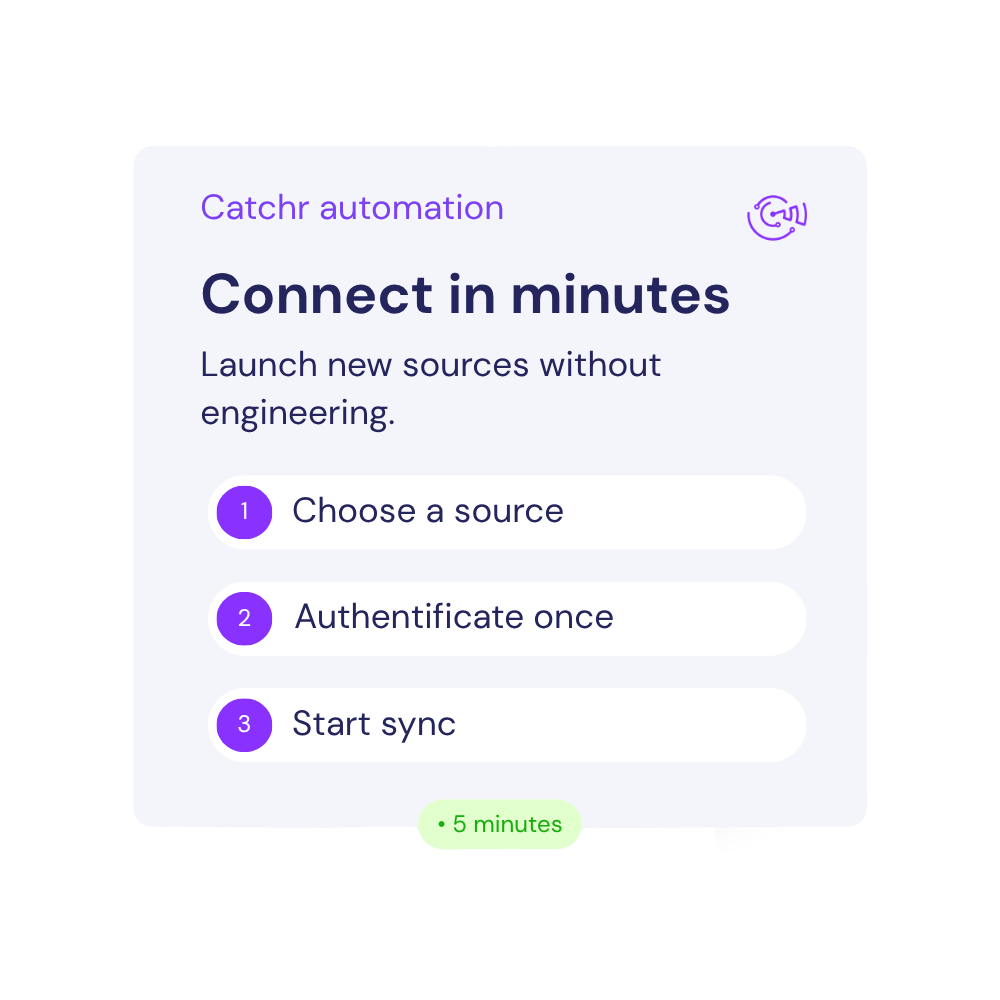
How to connect Google Analytics to Claude ?

Three steps to your first source-aware prompt.

Step one

Authorize the Google Analytics account in Catchr

Select Google Analytics, sign in, and choose the client or business accounts you want to connect.

Client A · Connected sources
5 sources ready
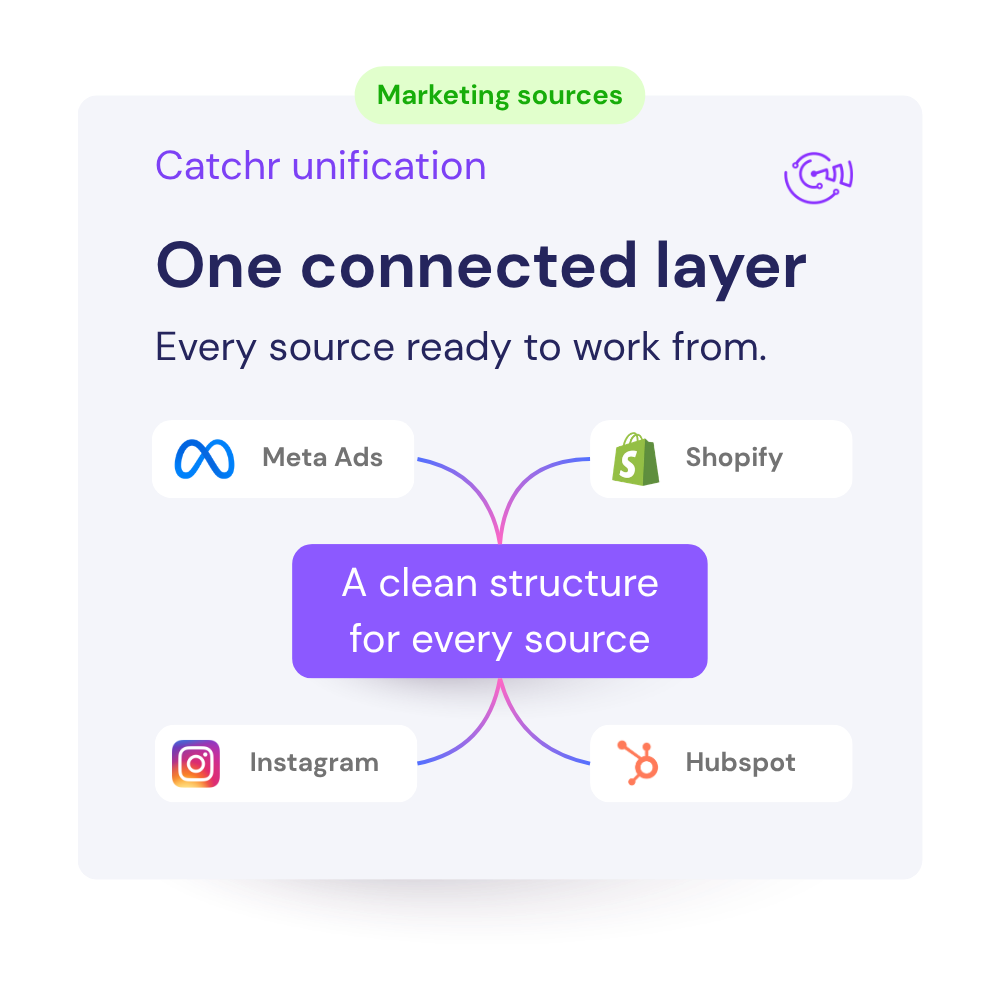
Meta Ads 3 advertising accounts Connected
Google Ads 2 advertising accounts Connected
Google Analytics 4 1 web property Connected
HubSpot 1 CRM portal Connected
Step two

Add the Catchr MCP as a custom connector in Claude

Configure the Catchr remote MCP connection in Claude using the connector details from Catchr.

Step three

Choose, adapt, and run a prompt.

Replace account, period, KPI target, and threshold variables before you ask Claude.

A simple client question should not trigger an hour of data prep.

“Why did CPA rise?” sounds simple. The answer is usually buried across exports, formulas, filters, and tabs before the analysis can even start.

Pull another CSV

Choose the right account, date range, breakdowns, and fields. Then wait for the file and do it again when the question changes.

Rebuild the context

Rename columns, fix formats, join tabs, and check formulas before you can trust the comparison.

Summarize it by hand

Turn the numbers into a client-ready answer, then repeat the whole process for the inevitable follow-up.

Ask the account. Get to the explanation.

Catchr MCP gives Claude access to the marketing accounts you select, so each follow-up starts with the same marketing context instead of a new manual export.

The hard way

Prepare data before every question.

  • Export files from the marketing platform
  • Reformat and reconcile columns
  • Rebuild the analysis for each follow-up
The Catchr way

Connect once. Keep asking.

  • Select the right accounts and data
  • Ask in the language your team already uses
  • Investigate with follow-up questions

Twelve Google Analytics prompts for analyzing real account data.

Choose your role, open a workflow, then replace the bracketed variables before pasting the prompt into Claude. Every prompt asks for evidence, limits, and a concrete output.

Agency promptCopy prompt
Multi-Client Google Analytics Health Radar
Using the Catchr MCP, analyze Google Analytics for [List of Client Accounts] over [Reporting Period] against [Comparison Period]. For each account, review Sessions, Conversions, and Engagement rate and break the results down by Session source / medium and Default channel group. Focus on traffic quality and acquisition efficiency. Rank accounts as Healthy, Watch, or Critical using [Client Targets or Historical Baseline], and show the evidence behind each status. Return a client-ready table with the account, main change, supporting fields, business implication, recommended next action, and one sentence for the next client meeting. Separate observed changes from possible explanations, respect the reporting grain, and do not claim causation when Google Analytics only shows correlation.
Client-Ready Google Analytics Performance Brief
Using the Catchr MCP, review Google Analytics for [Client Account] during [Reporting Period] versus [Comparison Period]. Review Engagement rate, Active users, and Total revenue and break the results down by Session campaign and Google Ads campaign. Explain what improved, what declined, and which changes are material for acquisition, landing-page, engagement, event, and conversion performance. Produce an executive summary, three evidence-backed wins, three risks, and a prioritized action plan with owner and review date. Include a compact evidence table that ties every conclusion to the returned fields. State any unavailable field, incompatible reporting level, or small-sample limitation before recommending action, and write the final recap in language an agency account manager can use with the client.
Google Analytics Opportunity and Risk Map
Using the Catchr MCP, compare Google Analytics across [List of Client Accounts] for [Period] using [Materiality Threshold] and [Client-Specific Targets]. For every account, review Total revenue, Return on ad spend, and Sessions per user and break the results down by Campaign and Region. Investigate landing-page engagement and conversion gaps and device, market, event, and channel differences. Build an opportunity-and-risk map ranked by business relevance, confidence, and urgency. For each finding, show the account, observed change, supporting fields, plausible explanations, first validation step, and recommended client action. Keep each client separate before creating a portfolio summary, and avoid applying one account's baseline, currency, attribution rule, or reporting definition to another.
Morning Google Analytics Priority Queue
Using the Catchr MCP, pull Google Analytics for [List of Client Accounts] over [Recent Period] and compare it with [Baseline Period]. For each client, review Sessions per user, Engaged sessions, and 1-day active users and break the results down by Session default channel group and First user default channel group. Flag changes beyond [Alert Threshold], separate high-value issues from low-volume noise, and rank the work I should handle today. Return a queue with the client, issue, exact evidence, likely impact stated cautiously, first validation step, recommended action, and a short update I can send to the client. Do not merge accounts until each result has been checked against its own target, currency, timezone, and reporting grain.
Monthly Google Analytics Client Report
Using the Catchr MCP, create a monthly Google Analytics report for [Client Account] covering [Current Period] versus [Previous Period]. Review 1-day active users, 28-day active users, and 7-day active users and break the results down by Month of the year and Session source. Explain the most important movement in acquisition, landing-page, engagement, event, and conversion performance, including what stayed stable and what needs attention. Write a plain-English report with an executive summary, a concise evidence table, three wins, three concerns, and three actions for [Next Period]. Attach an owner and success measure to each action. State the latest available date and any missing fields or intervals so the client can distinguish measured facts from assumptions or incomplete coverage.
Google Analytics Optimization Backlog
Using the Catchr MCP, analyze Google Analytics for [Client Account] over [Lookback Period]. Review 7-day active users, Cohort active users, and Session conversion rate and break the results down by Source / medium and Source. Identify the largest opportunities related to traffic quality and acquisition efficiency and device, market, event, and channel differences, then create an optimization backlog ranked by expected impact, effort, and confidence. For every task, include the observed evidence, a specific action, an owner, a due date, a success metric, and a guardrail that would stop the test. Use [Minimum Volume] and [Materiality Threshold] to avoid reacting to noise, and label any recommendation that requires a field or business definition not available in the returned dataset.
Google Analytics Acquisition Quality and Conversion Review
Using the Catchr MCP, analyze Google Analytics for [Account or Entity] over [Reporting Period] versus [Comparison Period]. Review Session conversion rate, User engagement, and User conversion rate and break the results down by Medium and Session campaign ID. Concentrate on traffic quality and acquisition efficiency. Identify the entities and periods driving the largest change, distinguish material movement from normal variation using [Minimum Volume] and [Business Target], and explain what the available fields can and cannot prove. Return a ranked findings table with evidence, business implication, confidence, and recommended next action, followed by a short decision summary. Keep calculations at a compatible reporting grain and do not invent a metric when Google Analytics exposes only a related signal.
Google Analytics Landing Page Opportunity Map
Using the Catchr MCP, investigate Google Analytics for [Account or Entity] across [Period] with a focus on landing-page engagement and conversion gaps. Review User conversion rate, Average purchase revenue per user, and Events per session and break the results down by Session Google Ads campaign ID and Session Google Ads campaign. Compare relevant entities against [Target, Peer Group, or Historical Baseline], then locate the strongest opportunities and clearest deterioration. For every finding, show the returned values, comparison dimension, possible explanations, and next check required before action. Deliver a prioritized opportunity map with owner, action, expected signal of improvement, and review date. Treat associations as hypotheses unless the available Google Analytics fields establish a direct relationship.
Google Analytics Channel and Device Behavior Analysis
Using the Catchr MCP, review Google Analytics for [Account or Entity] over [Lookback Period] to assess device, market, event, and channel differences. Review Events per session, Event count per user, and Views per session and break the results down by Session Google Ads campaign type and First user Google Ads campaign ID. Flag changes outside [Tolerance], rank them by materiality and confidence, and separate confirmed data observations from possible operational causes. Return an exception table with the affected entity, period, supporting fields, severity, owner, first validation step, and recommended response. End with three repeatable monitoring rules, including the threshold, minimum volume, and required field. Do not present an unusual value as proof of an error or business cause.
Google Analytics Data Quality Audit
Using the Catchr MCP, audit Google Analytics for [Account or All Connected Accounts] over [Period]. Review Views per session, Views per user, and Average session duration and break the results down by First user Google Ads campaign and First user Google Ads campaign type. Check completeness, unexpected nulls, duplicate identifiers at [Expected Grain], invalid values, incompatible aggregation levels, and date consistency where the returned fields support those tests. Return rule-level failure counts and a severity-ranked exception sample with account, field, observed value, expected condition, and reproducible validation step. Distinguish source-data issues from extraction or modeling issues, and do not infer uniqueness, join keys, or business meaning unless confirmed in [Data Contract or Source Documentation].
Google Analytics Freshness and Coverage Monitor
Using the Catchr MCP, monitor Google Analytics delivery for [Account or All Connected Accounts] across [Lookback Period]. Review Average session duration, Crash-affected users, and Crash-free users rate and break the results down by Google Ads campaign ID and Google Ads campaign type. Measure date coverage, latest available record, row or entity volume, missing intervals, and field population against [Expected Schedule] and [Freshness SLA]. Flag stale extraction, flatlined volume, schema coverage changes, and gaps beyond [Absolute and Relative Thresholds]. Return an account-level health summary plus an investigation table with first affected period, supporting fields, likely failure domain stated cautiously, owner, and next validation query. Separate genuine source inactivity from a pipeline issue whenever the evidence cannot distinguish them.
Google Analytics Drift and Reconciliation Review
Using the Catchr MCP, compare Google Analytics across [Current Window] and [Baseline Window] for [Account or All Connected Accounts]. Review Crash-free users rate, New users, and Scrolled users and break the results down by First user source / medium and Month. Profile distributions, null rates, distinct-value counts, volume, and material changes at the declared reporting grain. Reconcile related fields only when their definitions and aggregation levels are compatible. Flag abrupt shifts beyond [Drift Threshold], inconsistent totals, and values that violate [Business or Data Contract Rules]. Produce a reproducible alert table with evidence, severity, probable domain, and next check, followed by a concise assessment of which analyses may be unreliable until each issue is resolved.
Replace [variables] Facts ≠ hypotheses Action + follow-up metric

Google Analytics to Claude FAQs

Clear answers for marketers comparing connectors, data sources, reporting workflows, and dashboard setup.

What Google Analytics data can Claude analyze through Catchr?

Claude can query connected Google Analytics data for acquisition, landing-page, engagement, event, and conversion performance. Representative available fields include Sessions, Conversions, Engagement rate, Active users, and Total revenue. Useful breakdowns include Session source / medium, Default channel group, Session campaign, Google Ads campaign, and Campaign.

Claude analyzes the Google Analytics records returned through the selected Catchr connection. Exact availability can vary by selected account, report type, permissions, and requested period, so Claude should state which returned fields support its answer.

How granular can Google Analytics analysis be in Claude?

The available detail depends on the selected Google Analytics dataset and the reporting grain of its fields. Useful breakdowns include Session source / medium, Default channel group, Session campaign, Google Ads campaign, and Campaign.

Ask Claude to state the grain, date range, timezone, filters, and any incompatible report types before it calculates totals, rates, or comparisons. Keep separate datasets apart unless their keys and definitions support a reliable join.

Can Claude compare Google Analytics performance across periods or accounts?

Yes, when the required fields are returned for the selected Google Analytics account. Claude can use Sessions, Conversions, Engagement rate, Active users, and Total revenue together with Session source / medium, Default channel group, Session campaign, Google Ads campaign, and Campaign to compare periods, entities, and targets.

Provide the account, period, comparison, business target, and minimum volume in the prompt. Claude should show the evidence behind each finding and identify any missing field before recommending action.

Can Claude investigate unusual changes in Google Analytics?

Claude can flag patterns and exceptions supported by the available Google Analytics records. It can compare Sessions, Conversions, Engagement rate, Active users, and Total revenue across Session source / medium, Default channel group, Session campaign, Google Ads campaign, and Campaign and rank the issues that deserve review.

An unusual value is not proof of a cause or operational error. Ask Claude to separate observations, possible explanations, and the next validation step so the result remains useful and defensible.

What types of prompts work best for Google Analytics analysis in Claude?

Strong prompts specify the account, date range, comparison, threshold, available fields, and required output.

  • Monitor: Google Analytics Acquisition Quality and Conversion Review
  • Diagnose: Google Analytics Data Quality Audit
  • Find opportunities: Google Analytics Landing Page Opportunity Map
  • Report: Monthly Google Analytics Client Report

Can I combine Google Analytics with other data sources in Claude?

Yes, when the other sources are also connected through Catchr. Useful combinations for this category include advertising, CRM, and ecommerce sources.

Align account scope, dates, currencies, attribution rules, identifiers, and business definitions first. If the sources cannot be joined reliably, ask Claude for a side-by-side comparison rather than a single attributed result.

Can Claude compare multiple Google Analytics accounts or entities?

Yes, provided each account or entity is connected and available through Catchr. Ask for separate results first, then request a combined summary.

Give Claude the account list, period, target, timezone, reporting grain, and materiality threshold. This prevents one large account or a definition mismatch from distorting the comparison.

What do I need to connect Google Analytics to Claude with Catchr?

You need access that can authorize the relevant Google Analytics data, a Catchr workspace with the source connected, and Catchr MCP enabled in Claude.

After selecting the required accounts or entities, you can ask questions in natural language without preparing a new CSV export for every analysis. Available fields still depend on the source connection and permissions.

How recent is the Google Analytics data, and how much history can Claude analyze?

Claude analyzes the records returned through the connected Catchr source and should not treat them as automatically real time. Freshness and historical coverage can vary by dataset, field, selected period, account, and source API limits.

Ask Claude to state the latest available record date, extraction date when present, timezone, requested period, and any missing intervals before interpreting a trend.

Can Claude change anything in Google Analytics through Catchr?

No. Catchr MCP provides Google Analytics data to Claude for analysis; it does not give Claude permission to edit source records, change settings, move money, publish content, or modify campaigns.

Use the result to prepare an action plan, then make operational changes in Google Analytics with the appropriate access and review. Prefer aggregated outputs whenever record-level details are not required.

How much does it cost to connect marketing data to Claude with Catchr?

Catchr MCP is included in every standard plan—there is no separate fee for the Claude integration. The Starter plan begins at $20 per month when billed annually, or $24 when billed monthly. It includes 3 platforms, 10 accounts, unlimited users, and unlimited requests. Larger plans increase the number of platforms and accounts available. See Catchr pricing.

Can I try the Claude integration before choosing a plan?

Yes. Catchr offers a 14-day free trial with no credit card required. You can use the trial to connect your marketing sources, authorize Catchr MCP in Claude, and test questions using your own data before subscribing.

Still have a question ? 

Our teams is always here to responds to any question you could have about our data connector. 

Ask the account question before building another export.

Connect your marketing platform to Claude with Catchr MCP and start investigating current campaign performance.

14 days free-trial
No credit-card required
100+ sources