Power BI explained for Marketing Teams
Power BI is a business intelligence tool used by marketing teams to analyze campaigns, funnels, and performance data. Learn what Power BI is, how marketers use it, and what dashboards you can build.
Power BI is a business intelligence tool developed by Microsoft. It’s widely used across many teams, including Marketing, to create clear, professional dashboards and reports. Power BI helps teams visualize and analyze key metrics, uncover insights, and make data-driven decisions.
In this article, you'll learn:
- what Power BI is (in simple terms)
- how marketers use it
- who uses it in a marketing organization
- real examples of dashboards
What is Power BI? – Definition
Power BI is a business intelligence (BI) platform created by Microsoft that allows teams to collect, model, analyze, and visualize data in the form of interactive reports and dashboards.
At its core, Power BI helps transform raw data (tables, exports, databases, APIs) into structured insights that can be explored visually. Instead of working with static spreadsheets, users interact with charts, tables, filters, and drill-downs to understand what is happening in their data and why.
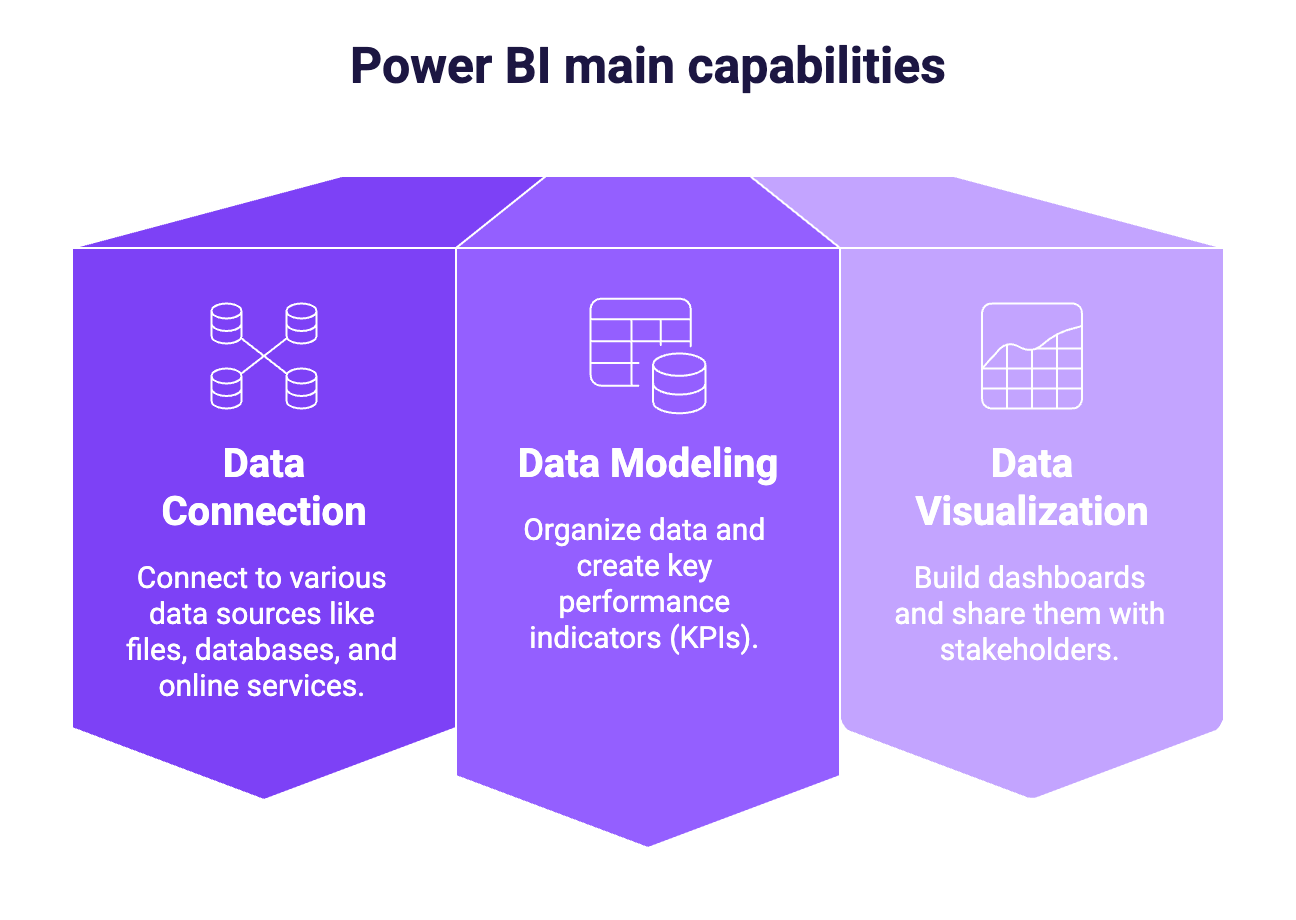
Power BI is built around three main capabilities:
- Data connection: connect to many types of data sources (files, databases, online services)
- Data modeling & calculations: organize data and create metrics (KPIs)
- Data visualization & sharing: build dashboards and share them with stakeholders
Power BI is part of the Microsoft ecosystem, alongside tools like Excel, Azure, and Microsoft 365, but it is designed for analytics and reporting at scale, not just individual analysis.
Importantly, Power BI does not create data on its own. It relies on existing data sources and focuses on making that data usable, understandable, and actionable through reporting and visualization.
Power BI for Marketing
Now, let's focus on Power BI for Marketing.
What is Power BI used for in Marketing
Marketing teams use Power BI to analyze performance across channels, campaigns, and the entire customer journey. Its main role is to bring clarity to fragmented marketing data and turn it into actionable insights. In practice, Power BI is commonly used for:
Campaign performance tracking
Monitor spend, impressions, clicks, conversions, and revenue across paid media platforms. Power BI makes it easy to compare campaigns, identify top performers, and detect underperforming initiatives.
Channel and mix analysis
Analyze performance by channel (Paid Search, Paid Social, Email, Organic, etc.) to understand where budget is most effective and how channels contribute to overall results.
Funnel and conversion analysis
Track how users move from acquisition to conversion, whether it’s visits → leads → customers in B2C, or Ads → Leads → Opportunities → Deals in B2B.
Budget pacing and performance monitoring
Follow spend versus targets over time and ensure campaigns are on track before the end of the month or quarter.
Recurring reporting and executive dashboards
Replace manual weekly or monthly reports with automated dashboards that update regularly and provide a shared source of truth.
Who uses Power BI in Marketing teams
Power BI can be used by different roles within a marketing organization, each with a different level of involvement.
- Performance and acquisition marketers: Use Power BI to monitor campaign results, compare channels, and optimize spend based on KPIs such as CPA, ROAS, or conversion rate.
- Marketing analysts and operations teams: Design data models, define KPIs, and build dashboards that standardize reporting across teams and regions.
- Growth and lifecycle teams: Analyze user behavior across touchpoints, cohorts, and retention metrics to understand long-term performance beyond first conversion.
- Marketing leadership (CMOs, Heads of Marketing): Consume dashboards to track high-level performance, trends, and progress toward objectives, without needing to build reports themselves.
- Agencies and consultants: Use Power BI to manage multi-client reporting and deliver standardized dashboards to their customers.
Where Power BI fits in Marketing data stack
Power BI sits at the analysis and visualization layer of the marketing data stack.
It does not replace marketing platforms, analytics tools, or CRMs. Instead, it connects to them and transforms their data into insights.
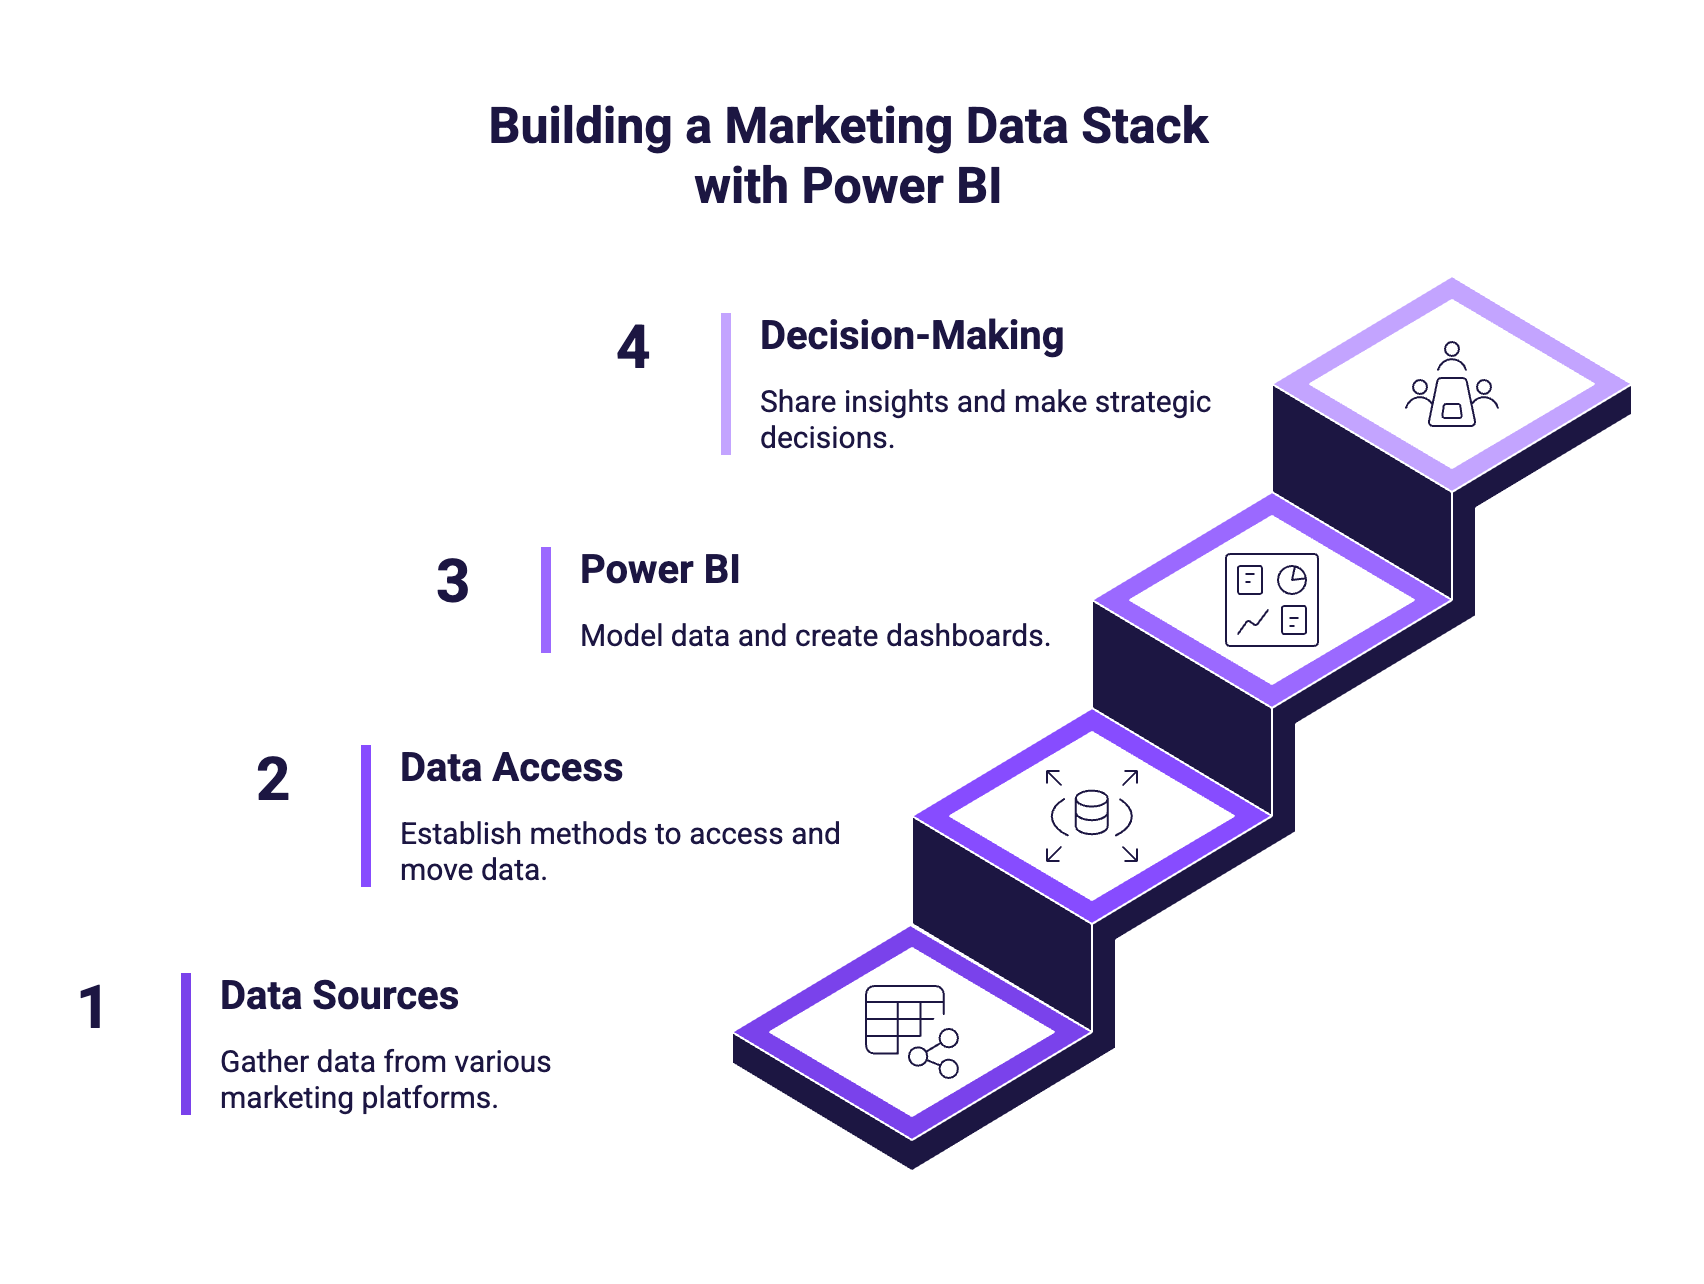
A simplified marketing data stack looks like this:
- Data sources: Advertising platforms, web analytics tools, email platforms, CRMs, and internal data.
- Data access and movement: Data can be accessed via exports, APIs, connectors, or data warehouses, depending on the level of automation and scale needed.
- Power BI: Used to model data, calculate KPIs, and build dashboards and reports.
- Decision-making and reporting: Dashboards are shared with teams and stakeholders to support daily optimization and strategic decisions.
Is Power BI a good choice for Marketing?
Power BI is a strong option for marketing teams that need flexible, scalable, and reliable reporting, especially when working with multiple data sources.
For many marketing teams, Power BI becomes most valuable once they move beyond spreadsheets and platform-native reports and need a single source of truth for performance analysis.
Typical Marketing dashboards you can build with Power BI
Power BI lets marketing teams build dashboards that range from platform-specific monitoring to cross-channel performance reporting. Here are the most common ones to start with.
GA4 performance dashboard (Website & conversion tracking)
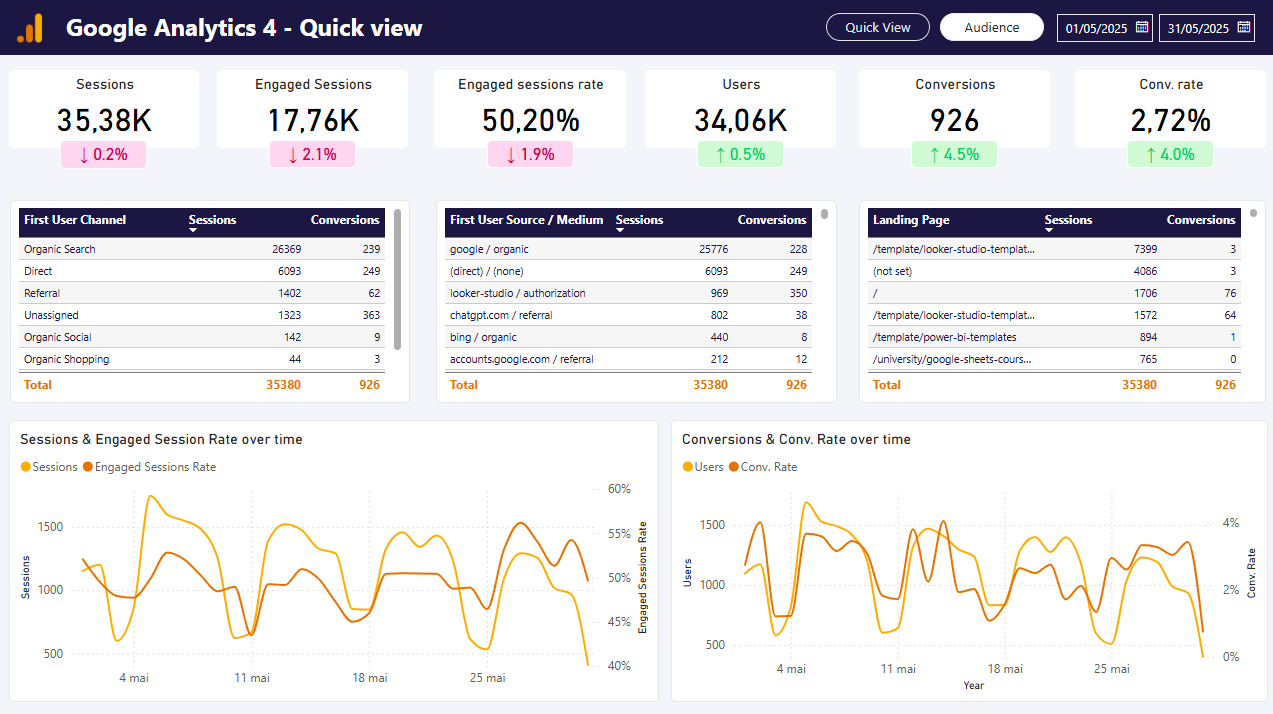
Use this dashboard to understand how your site is performing and how users convert.
You typically track sessions, users, engagement metrics, key events, and conversions, with filters such as date range, channel group, country, device, landing page, or campaign.
Get this GA4 dashboard template for Power BI
Meta Ads dashboard (Paid social performance)
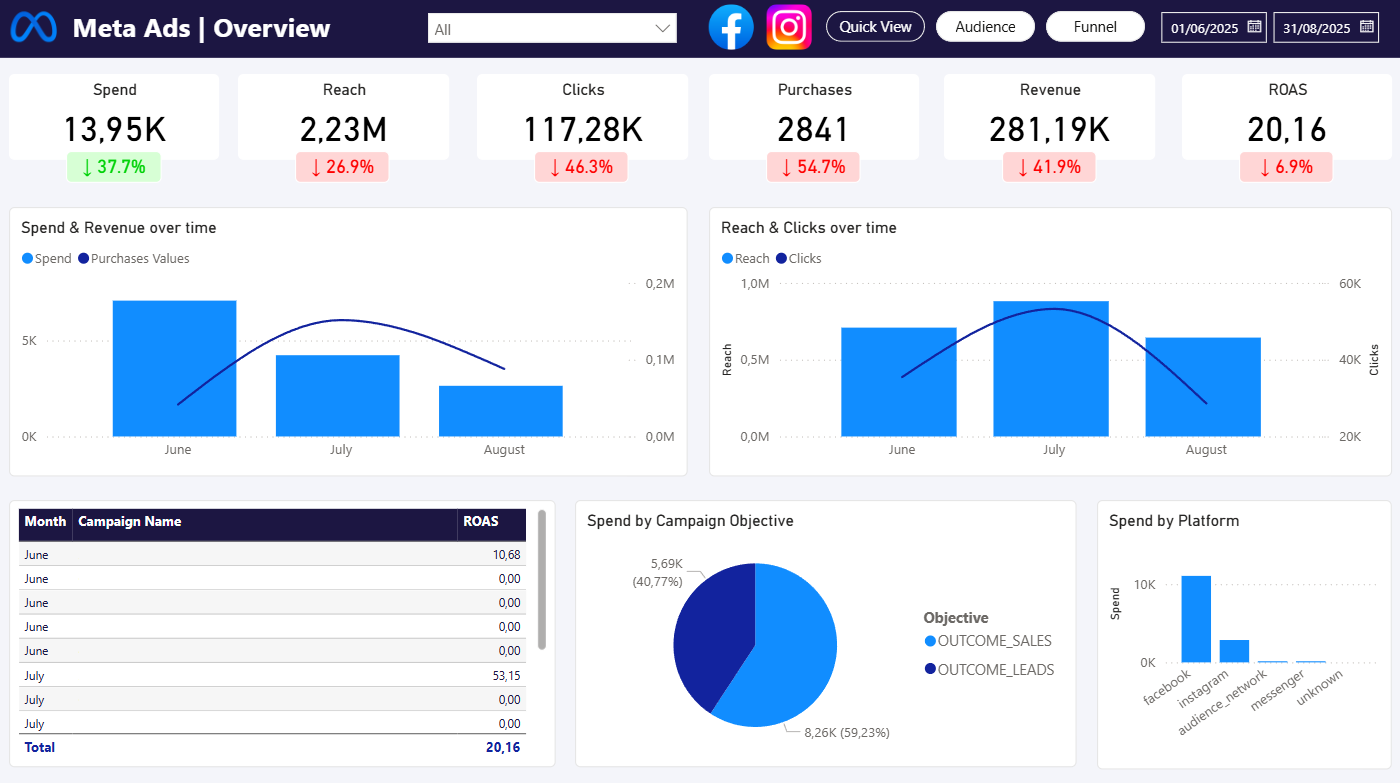
This dashboard focuses on campaign efficiency and budget optimization.
It usually includes spend, impressions, reach, clicks, results, and KPIs like CPM, CPC, CTR, CPA, and ROAS, with drill-down from campaign to ad set to ad to quickly identify what’s driving performance.
Get this Meta Ads dashboard template for Power BI
Google Search Console dashboard (SEO performance)
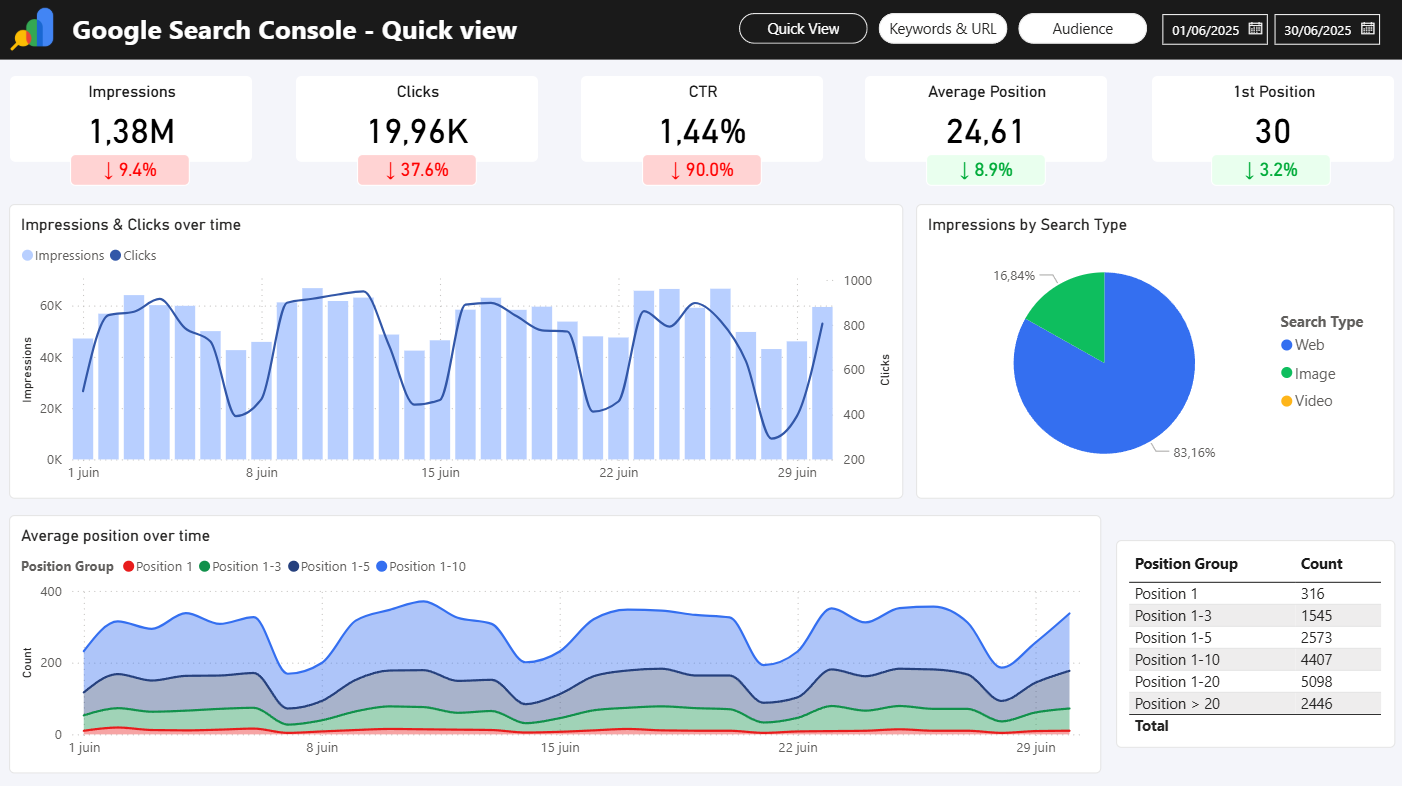
This dashboard helps you monitor organic search visibility and identify growth opportunities.
Common metrics include clicks, impressions, CTR, and average position, segmented by query, page, country, device, and search type, with period comparisons to spot changes over time.
Get this Google Search dashboard template for Power BI
Cross-channel marketing performance dashboard (The “single view”)
Once you have a few sources, many teams build a unified dashboard to compare channels side by side and understand what’s driving results.
Typical views include spend vs outcomes by channel, CAC/ROAS by channel, and performance trends across Paid Search, Paid Social, SEO, and Email.
Executive marketing dashboard (Leadership reporting)
Designed for stakeholders who want a clear summary, not operational details.
It usually includes a KPI snapshot, key trends, highlights and drivers, plus a short section for insights and recommended actions.
What you need to get started with Power BI?
Getting started with Power BI does not require advanced technical skills, but a few fundamentals make the process much smoother:
- Access to your marketing data, whether it comes from advertising platforms, analytics tools, a CRM, or simple Excel or CSV exports
- Clearly defined KPIs, as Power BI is most effective when metrics such as conversions, CPA, or ROAS are well understood upfront
- Power BI Desktop, which is sufficient to start building reports and is available for free
- Time to learn the basics, such as data structure, filters, and measures, which allows marketers to become productive without a data background
Frequently Asked Questions (FAQ)
Can Power BI replace Google Sheets for reporting?
Power BI does not replace Google Sheets entirely, but it often replaces spreadsheets for recurring and shared reporting. While spreadsheets remain useful for ad hoc analysis and quick calculations, Power BI is better suited for automated dashboards, consistent KPI definitions, and reports that need to scale across teams.
Is Power BI suitable for small marketing teams?
Yes, Power BI can work well for small marketing teams, particularly when reporting needs grow beyond manual spreadsheets. Teams can start with simple dashboards and add complexity over time as data volume and reporting requirements increase.
Can Power BI connect to marketing platforms?
Power BI can connect to marketing platforms in different ways, including manual file exports, direct APIs, dedicated connectors such as Catchr.io, or a data warehouse. The right approach depends on the level of automation and scale you need, but in most cases, marketing data from common platforms can be brought into Power BI and analyzed in a consistent reporting model.
Is Power BI better than Looker Studio for marketing?
Power BI and Looker Studio serve similar purposes but differ in depth and flexibility. Looker Studio is often easier to start with and works well for lightweight reporting, while Power BI offers more advanced data modeling, calculations, and scalability, which can be valuable for growing or more complex marketing teams.
What's next?
Now that you understand what Power BI is and how it can be used for marketing, you can move on to the next lessons. In this Power BI learning path, we’ll cover the fundamentals, walk through the first steps of data modeling, show how to build and share dashboards, and introduce the basics of DAX formulas.

.svg)