Connect Excel to Power BI: Guide
Learn how to use Excel with Power BI, prepare Power BI–friendly files, avoid common mistakes, and build reports that refresh without breaking.
Excel is one of the most common data sources for Power BI, especially for marketing teams, and it’s often the easiest way to get started. Most issues, however, come from poorly structured Excel files. Formatting that works for presentations can break reporting once the file is used as a data source.
This article explains how to prepare a truly Power BI–friendly Excel file so your reports are easier to build, refresh, and maintain.
How Power BI works with Excel files
Before going into tutorial and best practices, it’s important to understand how Power BI interprets an Excel file when you import it.
What happens when you import an Excel file
When you import an Excel file into Power BI, each worksheet is treated as a table. Power BI assumes that the first row contains column headers, and it automatically tries to detect data types for each column, such as dates, numbers, or text.
Power BI does not read Excel formatting or layout logic. It focuses only on the underlying tabular structure. Understanding this behavior helps explain why some Excel files work well and others cause issues, even before any visuals are created.
Excel is not a report, it’s a data source
This is a key mindset shift. An Excel file used in Power BI should be treated as a data source, not as a presentation or report.
This means:
- No visual formatting
- No totals or subtotals inside the dataset
- No layout or storytelling logic in the file itself
Step-by-step: from an Excel export to a Power BI report
This step-by-step guide shows how to go from a typical marketing export to a clean Excel file ready for Power BI.
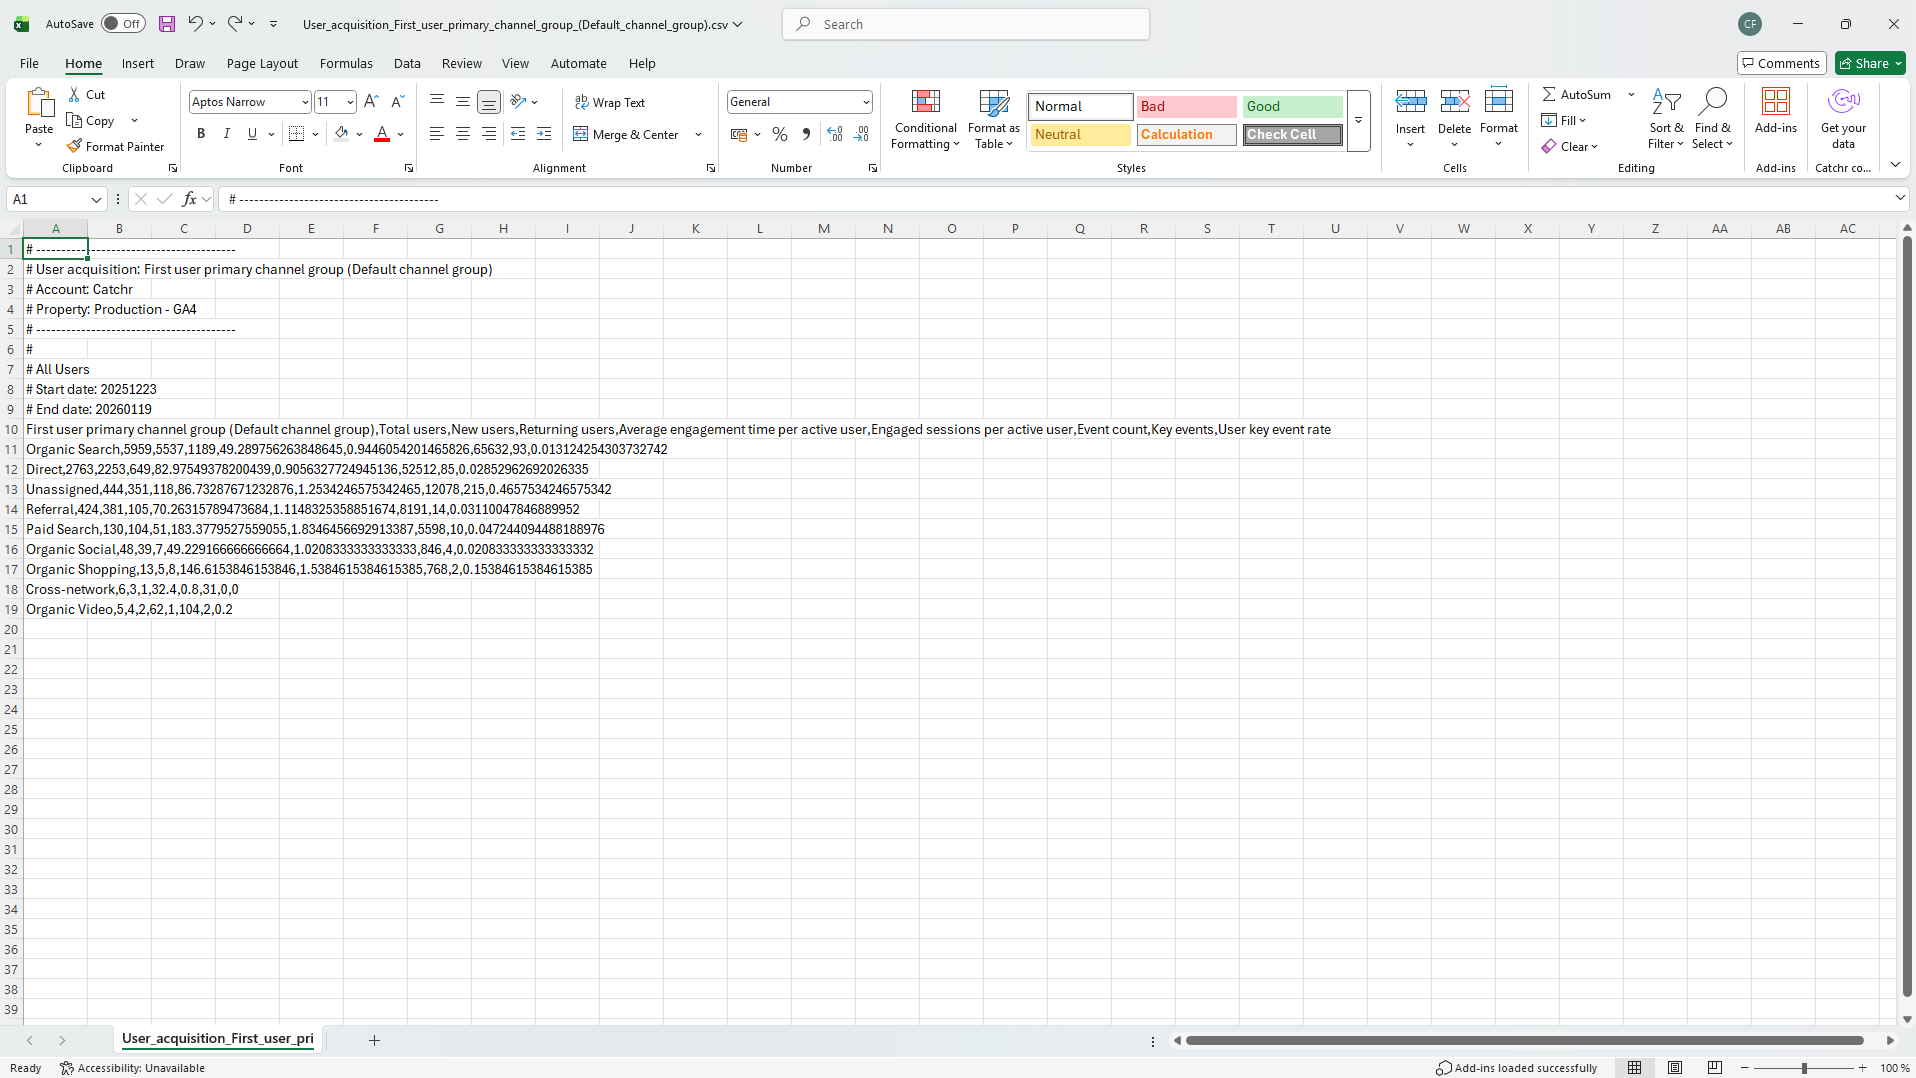
Step 1: Start from a raw export
Always begin with a raw export from your platform. The file should be flat, without subtotals, summary rows, or extra header lines. Each row should represent a single observation, such as a campaign on a given date or a page for a given period.
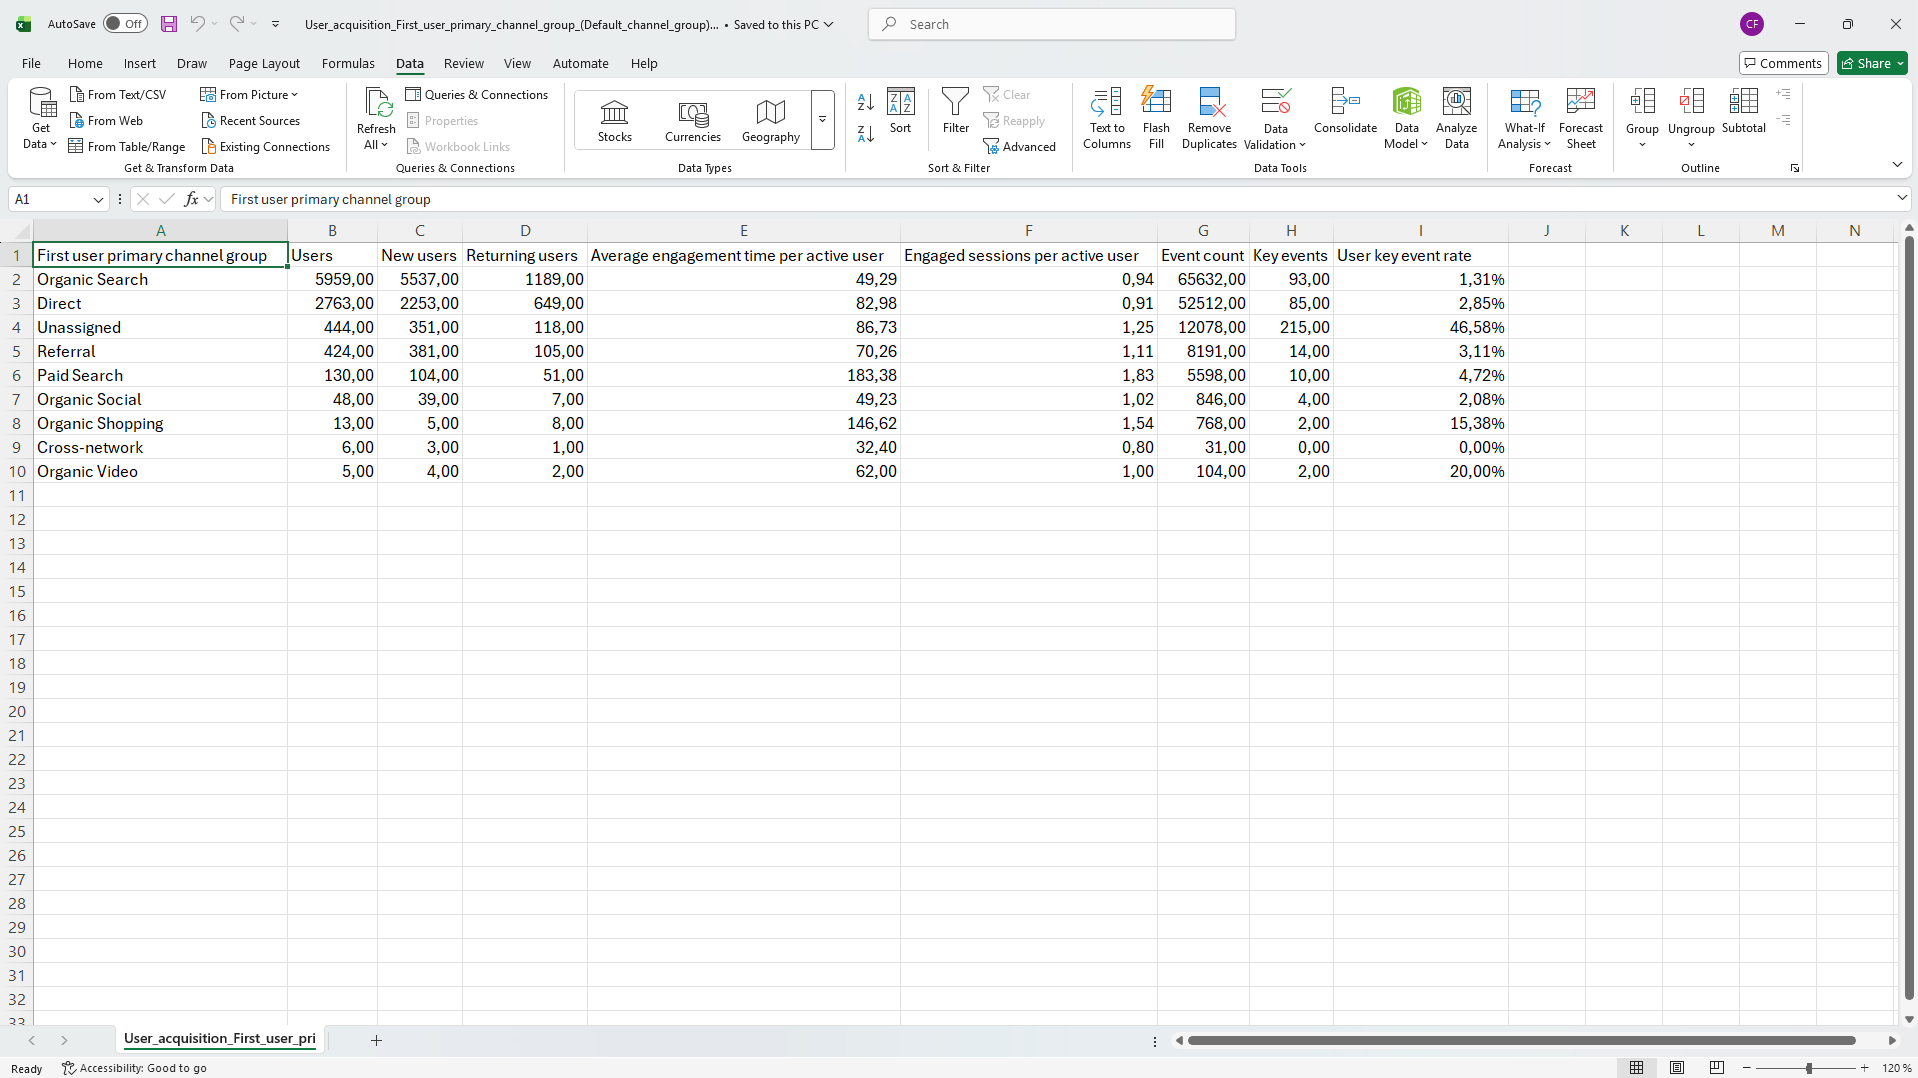
In this example, we’ll download a Google Analytics 4 export focused on User Acquisition, using the First user primary channel group dimension.
Step 2: Turn it into a clean table structure
Your Excel file should follow a simple table structure:
- One header row at the top
- One column equals one field
- No merged cells
- No empty columns or rows inside the dataset
This structure allows Power BI to read the data reliably and consistently.
Step 3: Standardize names and formats
Column names should be stable and descriptive, but not verbose. Dates must be real date values, not text. Metrics should be numeric, and currencies or decimal formats should be consistent across the file.
Standardizing names and formats early prevents issues later when building visuals or refreshing data.
Step 4: Save the file properly
Save your file in .xlsx format. Ideally, each file should contain one dataset, or at least one clean table per sheet. Use a simple and consistent file naming convention so files are easy to identify over time.

File with one sheet
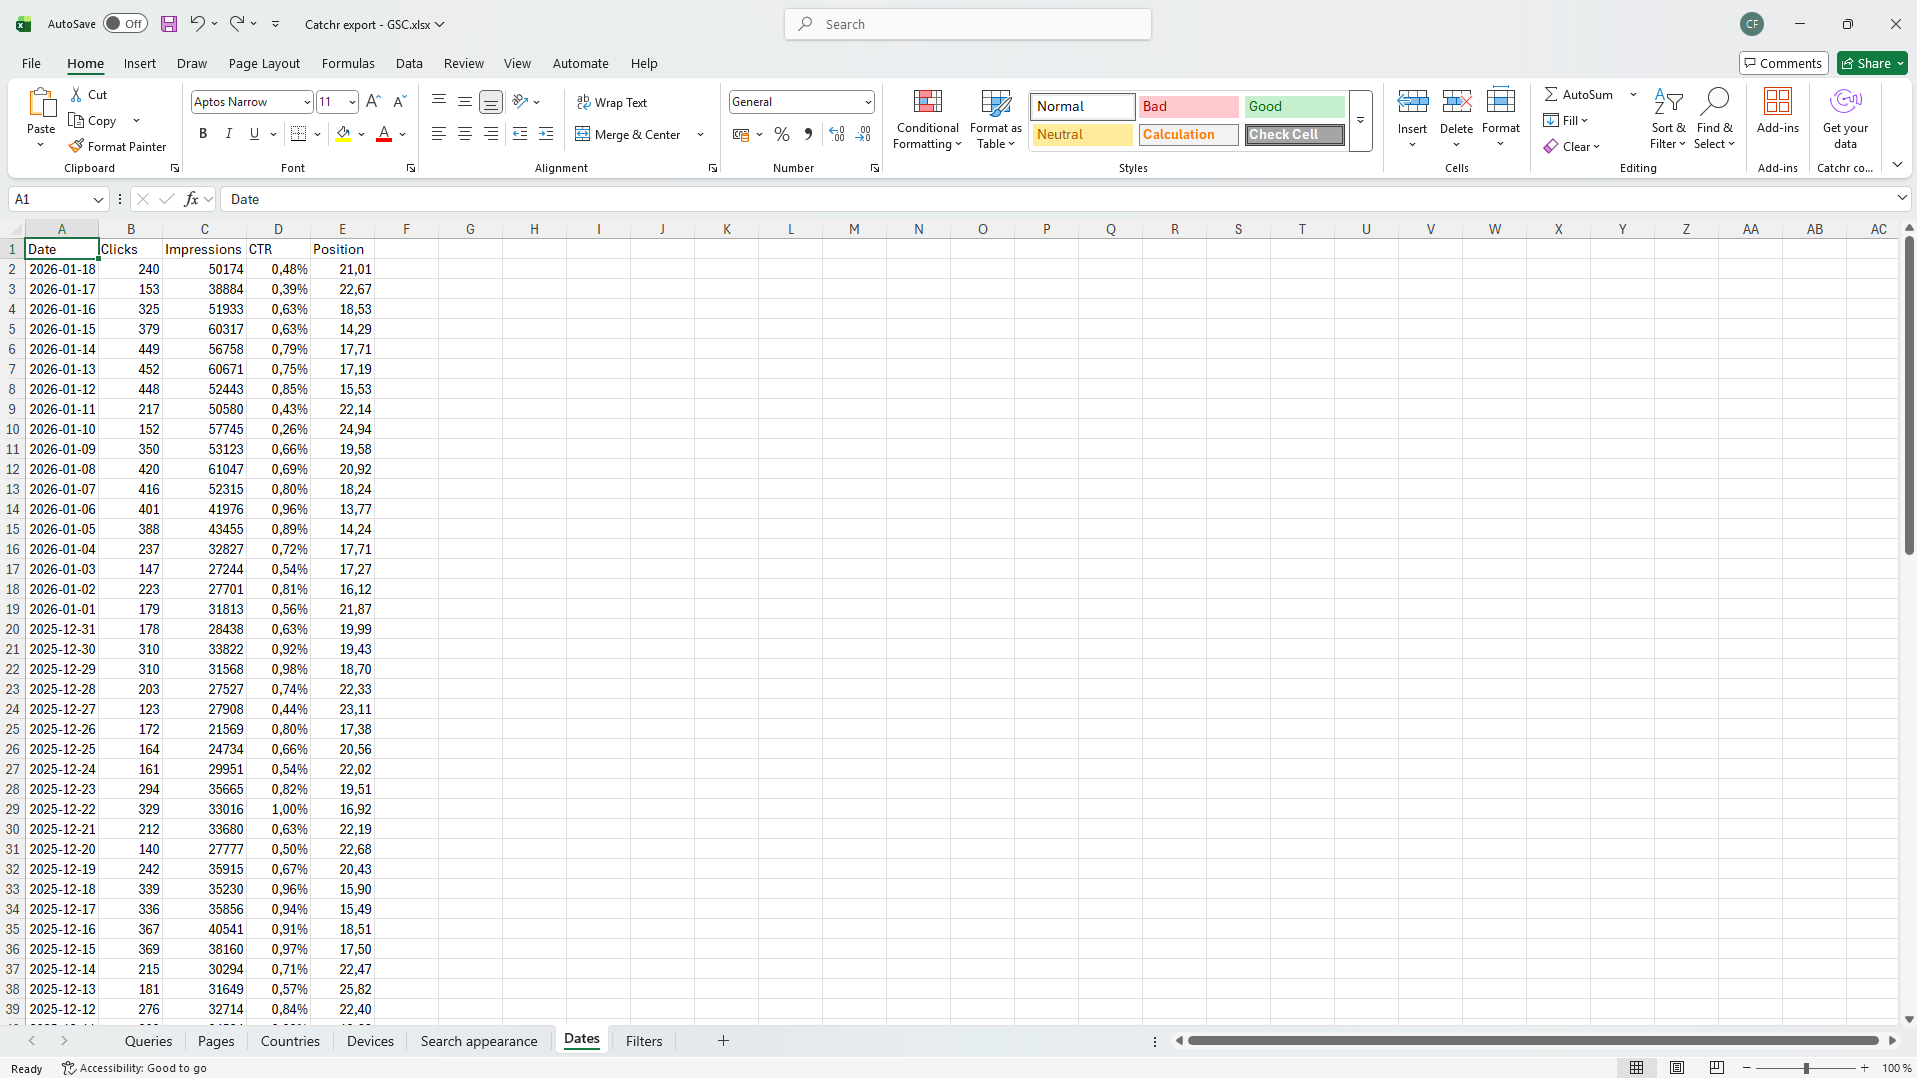
File with multiple sheets
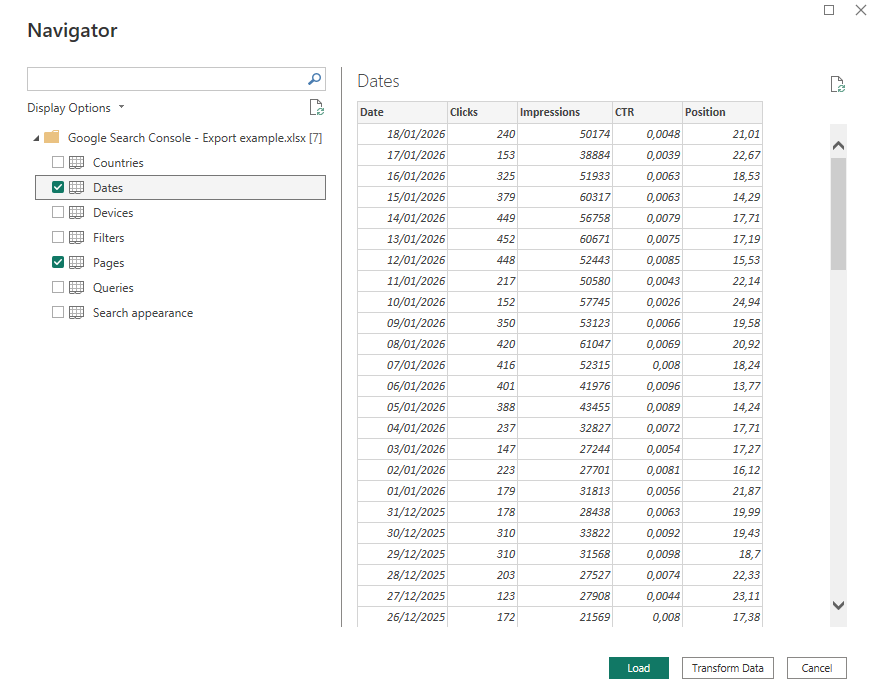
Step 5: Import into Power BI Desktop
In Power BI Desktop, click Get data, select Excel, choose your file, then select the relevant sheet or table. You can load the data directly, or open Transform data if minor adjustments are needed.

Step 6: Quick validation inside Power BI
Once the data is loaded, perform a quick check. Verify data types, scan a few values, and make sure the date field works correctly for filtering and time-based analysis. Catching issues at this stage saves time later.
Excel file checklist for Power BI reporting
Before importing an Excel (or CSV) file into Power BI, make sure that:
- The file contains one clean table, with one header row at the top.
- Headers are not empty and each column has a clear, stable name.
- The dataset is raw and non-aggregated, with no totals, subtotals, or averages inside the table.
- Each row represents one observation (for example one date, one campaign, one channel, one page).
- There are no merged cells, no extra titles, and no presentation formatting that breaks the table structure.
- There are no blank rows or blank columns inside the dataset.
- Dates are stored as real dates, not text, and numbers are stored as real numeric values.
- Column formats are consistent, especially for currency, decimals, and separators.
- The structure stays consistent across exports, with the same columns and naming, so refresh won’t break.
- Column names are written for analysis, not presentation (for example
clicksinstead ofTotal Clicks (last 30 days)).
Refresh data from an Excel file in Power BI
When you click Refresh in Power BI, Power BI re-runs the entire data connection and reloads the Excel file from its source. This means that all saved changes made in the Excel file, such as updated values, new rows, or deleted data, are imported into the Power BI model at the time of the refresh.
For the refresh to work correctly, the Excel file must be saved and accessible to Power BI (local path, network drive, or cloud location). If the file is open but not saved, Power BI will not detect the latest changes. The structure of the file (sheet names, tables, column names, and data types) should also remain consistent; otherwise, the refresh may fail or return errors.
During the refresh, Power BI applies all Power Query steps again (filters, transformations, calculated columns), ensuring that the dataset in Power BI matches the most recent version of the Excel source. This process guarantees that reports and visuals are always based on the latest available data at the moment the refresh is triggered.
When Excel stops being enough
Excel is an excellent starting point for Power BI reporting, but it quickly reaches its limits when the number of files grows, updates become repetitive, or dashboards need frequent refresh. At that stage, automation becomes essential. Excel can still be useful for one-off analysis, but it’s no longer enough for reliable, scalable reporting.
Conclusion
Excel works very well with Power BI, as long as it is used as a data source, not as a report. A clean structure, consistent formats, and simple conventions prevent most issues marketers face when building dashboards. Getting the Excel foundations right avoids unnecessary complexity and makes Power BI reporting far more reliable.
.svg)