Cohort, Retention & LTV in Looker Studio
Learn how to build a Cohort, Retention & LTV page in Looker Studio to analyse user loyalty, identify drop-offs, and measure long-term value across channels and cohorts.
The Cohort, Retention & LTV page is designed to show how user behavior evolves after acquisition. Instead of looking only at initial traffic or conversions, this page focuses on long-term performance, how often users return, how quickly they drop off, and how much value they generate over time.
Objectives of the Cohort, Retention & LTV report page
This page helps marketing, growth, product, and CRM teams measure the real quality of acquisition channels by linking retention with long-term outcomes such as repeat purchases, purchase value, engagement frequency, and overall lifetime value.
The goal is to move beyond session-level metrics and analyze users as cohorts (customer, account, segment, plan, etc.). This makes it possible to identify which channels bring visitors who return, engage, convert again, and ultimately generate long-term revenue, rather than those who only create superficial traffic.
Which charts to use on your Cohort, Retention & LTV Page
Each chart on the Cohort, Retention & LTV page should help you understand how users behave after their first interaction, whether they stay, return, convert again, or generate long-term value.
The right combination of visuals reveals both retention patterns and revenue growth, making it easier to identify strong cohorts and weak points in the lifecycle.
Cohort Table (Retention Heatmap)
The cohort table is the backbone of retention analysis. It groups users based on when they first arrived (by week or month) and tracks how active they remain over time. The heatmap effect makes it very easy to see retention decay: darker squares show strong engagement, while lighter ones highlight high drop-off.
For example, the table is usually generated by combining a cohort dimension (first session date) with period-based columns and a metric such as Sessions or Active Users. This format highlights how many users stay engaged over time and how quickly drop-off occurs.
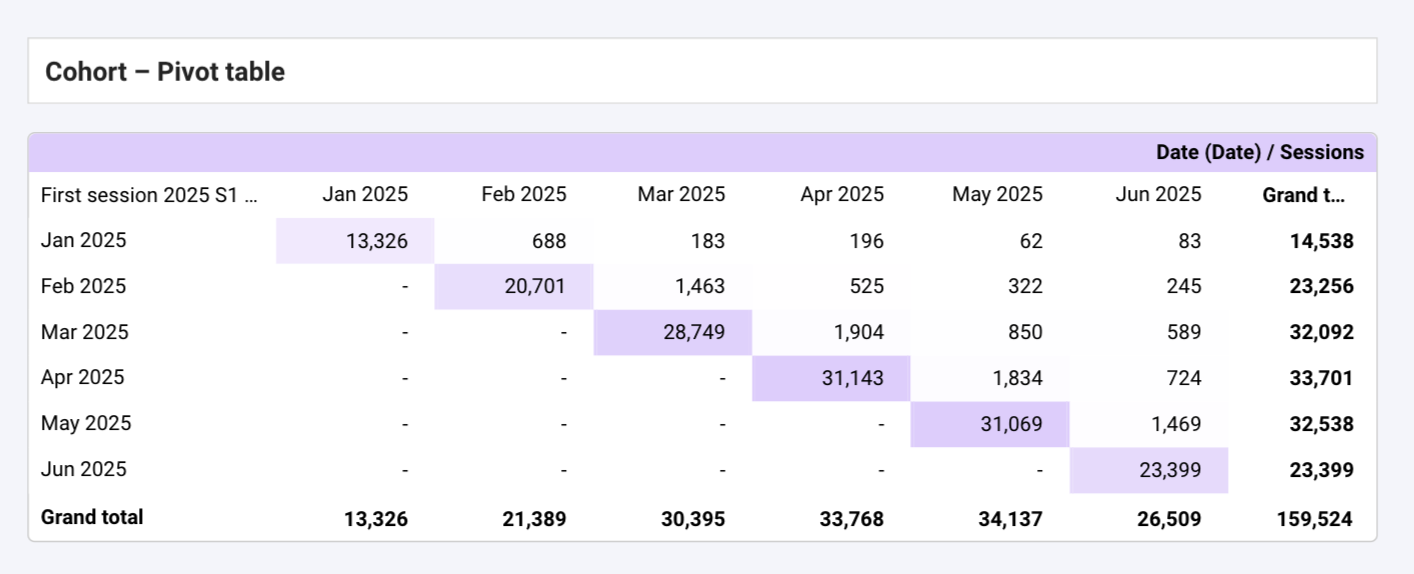
This chart helps you quickly detect patterns: whether new users from certain periods behave better, whether a recent UX change boosted retention, or which acquisition channel consistently attracts loyal users. To have a cleaner look you can remove null responds and show the most valuable information.
Retention Curve (Returning Users Over Time)
A retention line chart visualises how many users continue returning after their first session. It shows the “shape” of your user lifecycle: some products show a steep early drop, while others maintain stable engagement over weeks or months.
This chart helps you understand if changes in onboarding, content, or product features actually keep users active. It’s also useful when comparing retention across channels or campaigns.
LTV Line / Area Chart (Lifetime Value Over Time)
The LTV curve shows how revenue accumulates for different cohorts. Some cohorts generate most of their value early on, while others grow gradually over time. This is essential for evaluating the long-term profitability of acquisition sources.
This visual helps reveal if your users become more valuable after updates, if some channels produce high-value customers, or how long it takes to break even on acquisition costs.
Frequency Histogram (Visit Frequency Distribution)
A frequency distribution chart helps you measure user loyalty by showing how often users return within a given period. It makes the contrast between one-time visitors and high-frequency users immediately visible, revealing how consistently your audience comes back
In Looker Studio, you can build this visual using a bar chart with Total Users as the metric and Views per User grouped into ranges (via binning). By setting the bar width to 100% and applying conditional formatting, you can create a clean histogram effect where color intensity reflects the concentration of users in each frequency segment
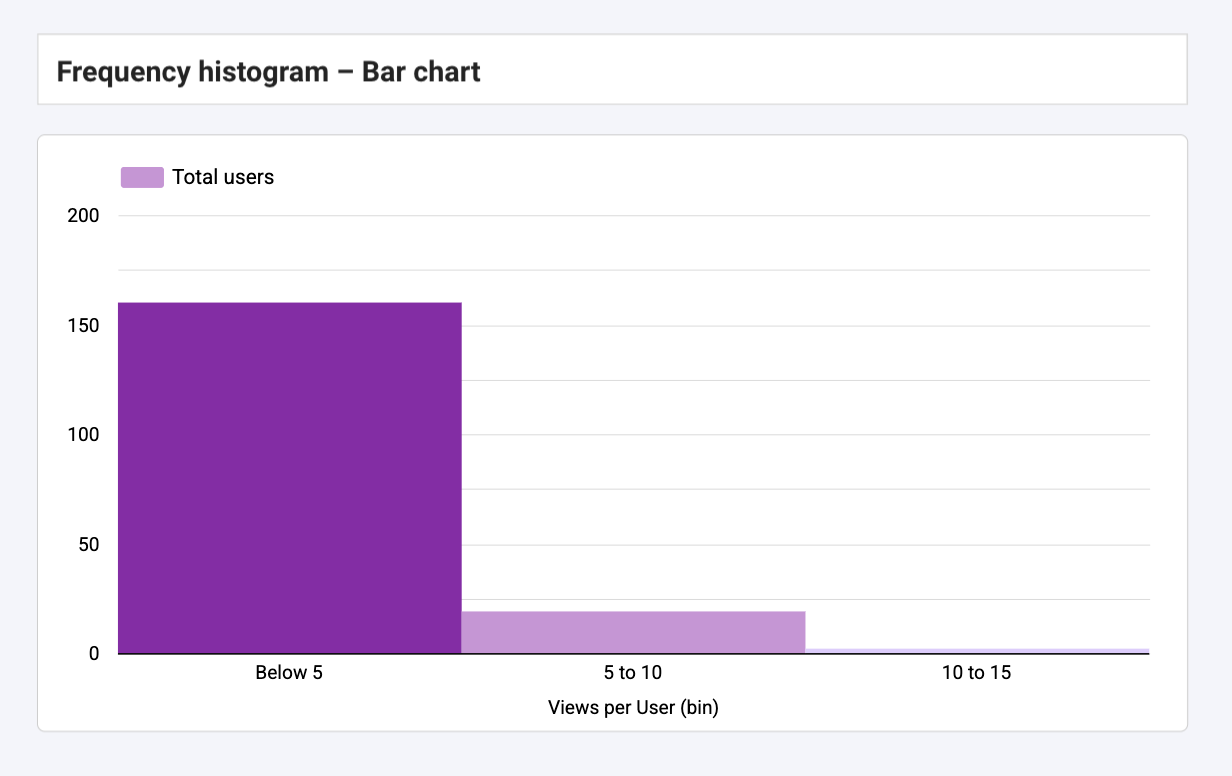
This chart is ideal for understanding how often users return and spotting clear behavioral patterns across your audience. It highlights which groups come back frequently and which ones drop off quickly, helping you identify strong loyalty segments as well as areas where re-engagement efforts may be needed.
Controls
Controls make your Cohort, Retention & LTV page fully interactive.
Because this page focuses on behavior over time, your controls should help isolate the cohorts, channels, devices, and periods that matter most.
The goal is simple: let users switch between cohorts, analyse specific acquisition sources, and compare retention patterns without cluttering the dashboard
Essential for adjusting the retention window (e.g., last 90 days vs. last 12 months).
This is especially useful when working with long-term metrics like LTV, which evolve gradually.
2. Acquisition Channel or Campaign
Useful for identifying which channels bring the most loyal or highest-value users.
Helps reveal differences between Paid Search, Organic, Email, Social, etc.
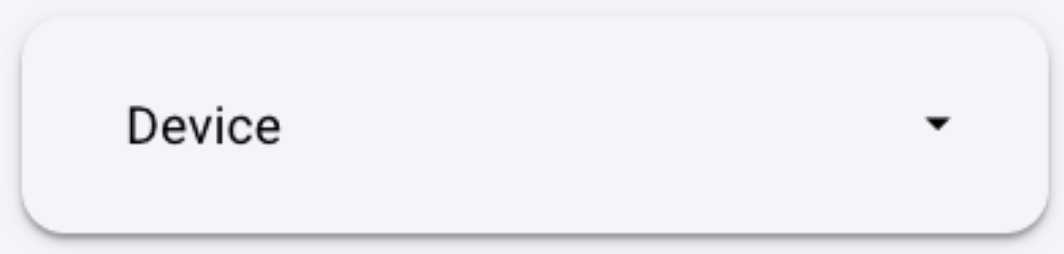
3. Device
Retention often varies significantly by device.
Mobile users tend to be less loyal in some industries, while app users may show stronger long-term engagement.
4. Country or Region
International audiences often behave differently.
This control helps you analyse retention and LTV by market.
Best Practices
A Cohort, Retention & LTV page must stay simple and focused on long-term behavior. The goal is to highlight patterns in loyalty, not overload the reader.
Keep it clear and effective by following these essentials:
- Focus on meaningful cohorts. Avoid displaying too many at once; limit to the last 6–8 or use filters to stay readable.
- Use a consistent color gradient. Dark = strong retention, light = weak. Patterns become instantly visible.
- Add context when behavior changes. Small notes for onboarding updates, UX changes, or campaigns help explain sudden retention shifts.
- Keep tables minimal. Only include key metrics like retention %, returning users, and LTV to avoid clutter.
- Choose readable scales. LTV evolves slowly, avoid micro-scales that hide real trends.
- Don’t mix acquisition data. Leave impressions, CTR, and CPA to Acquisition/Paid Media pages. This page should focus on post-acquisition behavior only.
Start with a Looker Studio template
Catchr offers a wide range of ready-to-use Looker Studio templates that help you build acquisition and behavior reports instantly. Instead of starting from a blank page, you can begin with a pre-structured dashboard such as :

After the trial, you can subscribe to continue syncing your data automatically or use the template as a foundation to build your own version with your current data sources. In either case, you will have a solid, well-structured starting point for your reports.
All templates are free to use and include a 14-day trial of Catchr’s connectors. This lets you explore and customize your reports before you subscribe.
