How to use parameters in Looker Studio
Learn what parameters are in Looker Studio, how they work, and how to use them effectively to create interactive and customizable reports.
Looker Studio allows you to dive deeper into your data analysis and test variables directly on your data sources to identify the most relevant values for your goals.
Learn how to configure dynamic calculated fields (such as calculating a profitable ROAS based on a maximum CPA parameter) or link interactive controls (input boxes, dropdown lists) for real-time updates. Mastering these variables lets you tailor your analyses to user needs, filter Google Analytics 4 events, or switch between different date granularities.
What is a Parameter in Looker Studio and why use it?
A parameter in Looker Studio is a dynamic variable that turns a static dashboard into an interactive tool. It lets users input custom values to adapt calculations and filters in real time.
Parameters make reports more flexible and personalized, reducing the need to duplicate dashboards for similar use cases. They can power dynamic metrics, custom SQL filters in BigQuery, or community connectors like Facebook Ads. For example, a parameter can adjust a ROAS (Return on Ad Spend) performance threshold or define input values used in calculated fields.
End users interact with the data through controls (input fields, sliders), instantly updating the visualizations. This approach addresses a key challenge: how to configure and use parameters to create interactive, customized reports, without unnecessary complexity.
Prerequisites
To create parameters in Looker Studio, you must have edit access to the data source.
Create a Parameter in Looker Studio

1. Access the Parameter Editor
To get started, connect to a data source, parameters apply to a specific source. For example, if your data comes from a Google Ads campaign, select that source.
To create your parameter:
- Go to Resource > Manage added data sources > Edit the data source where you want to add your parameter.
- Click Add a parameter.
2. Configure Parameter Properties
Name the parameter
Give it a clear and descriptive name, for example, “Maximum CPA” for cost-per-acquisition tracking. A meaningful name makes it easier for other users to understand its purpose.
The parameter ID is generated automatically. It’s used in formulas, such as parameter_cpa_max. This ID remains fixed even if you rename the parameter, so review it carefully when creating it.
Choose the data type and allowed values
- For a CPA, select Number (Decimal) to allow precise monetary values.
- For a country filter, choose Text.
- For an on/off setting, use Boolean.
Once saved, your parameter can be used in a calculated field and linked to an interactive control, providing a dynamic experience for users.
Integrating Parameters into your Looker Studio reports
Add the Parameter to a Calculated Field
Calculated fields in Looker Studio allow you to create new metrics from your existing data. When a parameter is included in a formula, it becomes a dynamic calculated field, its result adjusts automatically based on the user’s input or the parameter’s default value.
This approach transforms a static calculation into an interactive and customizable tool, ideal for building flexible reports tailored to different analytical needs.
Example: Estimated ROAS (calculated field with parameter)
Let’s take the example of a parameter called “Maximum CPA” (Cost Per Acquisition). The goal is to determine the minimum ROAS (Return on Ad Spend) required to be profitable by combining the acceptable maximum CPA with the average order value.
To do this, create a calculated field named ROAS with the following formula:
Average Order Value / Maximum CPA
The “Maximum CPA” parameter must be referenced using its parameter ID.
Once created, the field can be used in charts or tables. Any change to the “Maximum CPA” parameter (via a control or default value) will automatically update the displayed ROAS.
This dynamic field allows marketers to test different scenarios by adjusting the maximum CPA.
For example:
- A CPA of €10 with an average order value of €50 gives a ROAS of 5.
- Changing the CPA to €20 adjusts the ROAS to 2.5.
This flexibility helps optimize advertising campaigns without modifying the source data.
Link the Parameter to a Control
By linking a parameter to a control, viewers become active participants in the analysis, adjusting values based on their own assumptions. This interactivity enables real-time “what-if” analyses, turning the report into a true decision-support tool that’s both flexible and personalized.
To use your parameter in a control:
- Add a control to your report.
- Link the parameter to the control by selecting it in the Control field section.
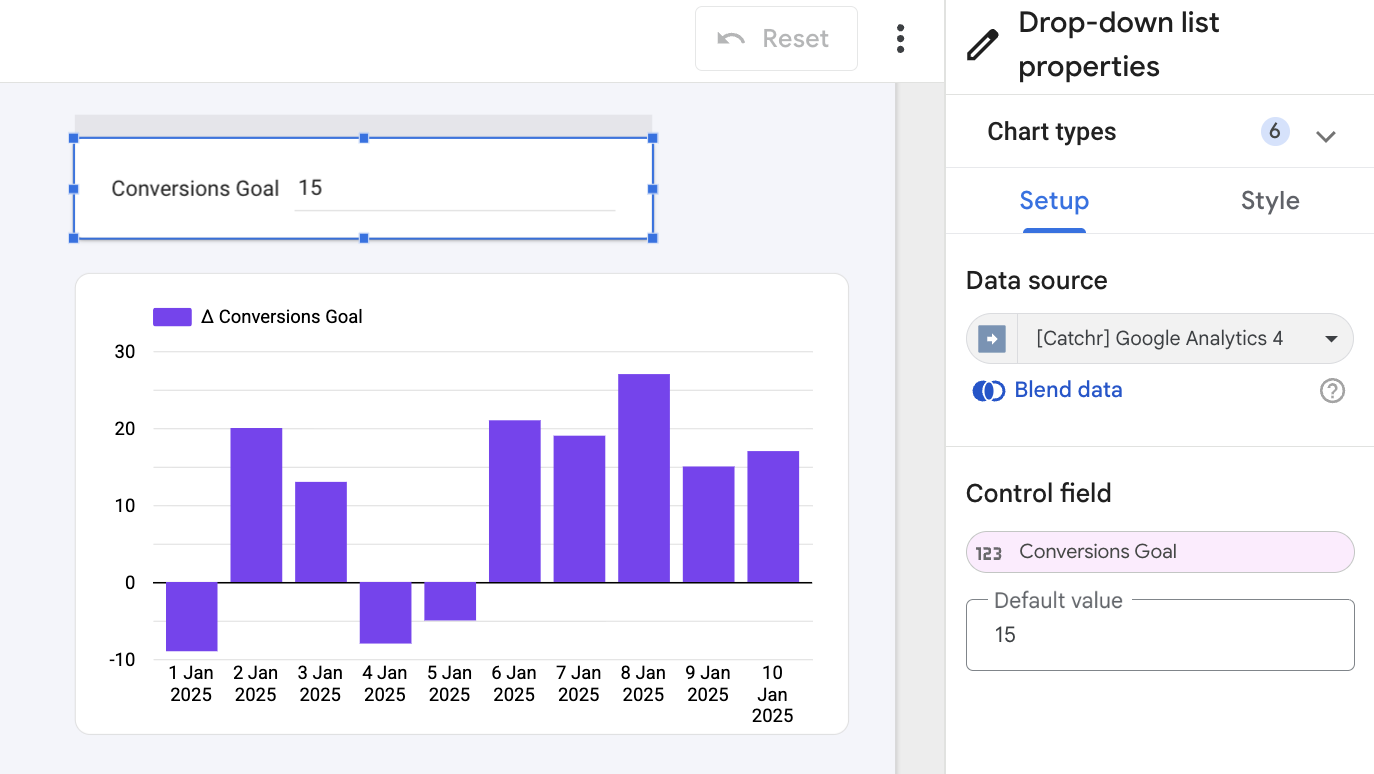
Test the Interactivity
Switch to View mode to verify that everything works correctly. An input field will appear, enter a value, and the charts will update in real time.
For example, change a conversion rate and observe its impact on margins. If you adjust the budget, the return on investment will automatically recalculate.
Best Practices
To ensure smooth use and prevent errors when configuring parameters in Looker Studio, it’s important to follow a few best practices.

Choose the right type of allowed values
Select the format that best fits the parameter’s purpose. You can limit inputs to a defined range (for example, from €1 to €100), offer a predefined list of values (such as regions or products), or allow free-form input when full flexibility is required. Each option should be chosen based on the level of control you want to maintain over user entries.
Set a default value
A default value, such as CPA = €25, ensures that the report works correctly as soon as it’s opened and prevents blank displays when no input is provided.
Choose the appropriate Control type
The control type should match the intended use of the parameter:
- Dropdown list: Ideal for offering limited, standardized choices such as a product or campaign.
- Input box: Allows manual entry of values, useful for adjusting a budget or conversion rate.
- Slider: Makes it easy to visually adjust numeric values, such as a target percentage.
- Checkbox: Enables or disables filters easily, for example a seasonal filter.
Applying these principles improves report clarity and enhances interactivity. Users benefit from a more intuitive experience, while report designers maintain control over the consistency and quality of the displayed data.
Advanced management: Parameter priority and URL modification
Understanding Parameter inheritance and priority
In Looker Studio, parameters follow a clear hierarchy to prevent conflicts: the more specific setting always overrides the more general one. A parameter defined at the chart level takes precedence over the page, report, or data source settings.
This logic is key for complex reports. For example, if a filter is set both at the report level and within a specific chart, the chart’s filter will apply. Misunderstanding this hierarchy can cause filtering errors or inconsistent data displays, especially in collaborative dashboards.
Imagine a marketing dashboard tracking multi-channel campaigns (Google Ads, Meta Ads, LinkedIn Ads).
At the report level, the “Period” parameter shows data for the current month.
On the Social Ads page, it’s redefined to show last quarter’s data, overriding the global setting for that page.
Finally, a LinkedIn Ads chart applies an even more specific parameter — displaying only the latest campaign. Result: this chart shows campaign data only, while the rest of the page displays quarterly metrics.
.png)
Customize reports via URL for automation
A powerful Looker Studio feature allows you to modify parameters directly through the report URL. This opens up advanced automation possibilities, such as pre-filling report templates for clients or generating interactive links with predefined values.
- Step 1: Enable the Modify in URL option for the relevant parameter by going to Resource > Manage parameters, then check the box next to the parameter you want to automate.
- Step 2: Create a JSON string containing the parameter ID and its value, for example:
{"param1": "value"}
- Step 3: Encode this string for URL compatibility to prevent formatting errors.
- Step 4: Append it to the report URL in the following format:
?params=ENCODED_STRING
As detailed by the developer community, this method is ideal for embedding customized reports into external tools or dynamic dashboards. It saves time while providing a tailored user experience, all without changing the underlying report configuration.
Conclusion
Parameters in Looker Studio transform reports into interactive, dynamic tools. They let users adjust values, test scenarios, and filter data in real time, making analysis more intuitive and decision-focused.
By combining parameters with calculated fields or URL automation, you can build flexible, customizable reports that update instantly, reduce duplication, and deliver a tailored experience for every user.

