How to use Data Control in Looker Studio
Learn how to use the Data Control in Looker Studio to switch data sources, compare results, and make your dashboards more flexible and dynamic.
If you use Looker Studio, you’re probably juggling between several accounts and multiple data sources. This often leads to a proliferation of reports. To simplify this work, Looker Studio offers a dedicated feature: the Data Control.
What is a Data Control in Looker Studio and why use it?
Definition: The Data Control for dynamic reports
The Data Control in Looker Studio is one of the interactive controls offered by the platform. It’s an interactive tool that allows users to change the data source of a report without needing to make manual adjustments. This eliminates the need to duplicate reports for different accounts.
Data Control fields in Looker Studio enable users to dynamically interact with report data by selecting or managing data sources, thus allowing real-time customization of visualizations.
Example: A YouTube report might display data from a marketing channel by default, but a viewer with access to a support channel can instantly switch to that data through the Data Control.
The key difference: with and without Data Control
Without Data Control, every modification to a dataset requires editing the report. With this feature, the change happens in just one click.
Imagine a Google Analytics report: without Data Control, you need to create a new report for each account view. With Data Control, a single report is enough. End users can freely choose which data they want to explore.
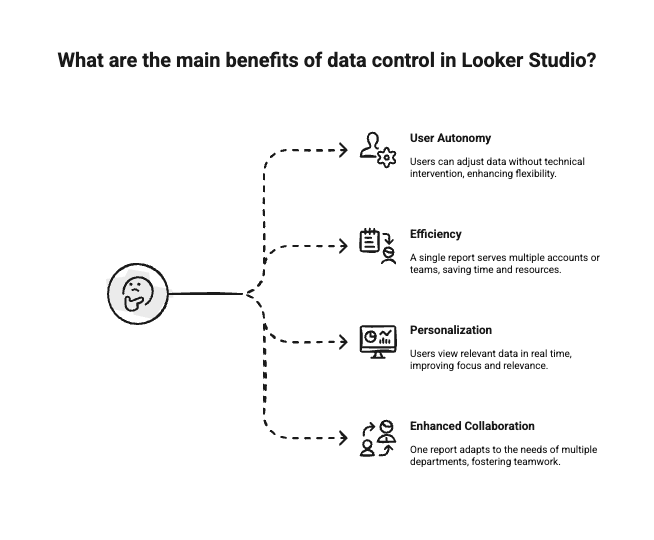
The main benefits for users and creators
The benefits go both ways. Creators avoid managing multiple reports, while viewers can explore the data most relevant to them.
- User autonomy: No technical intervention is required to adapt the data.
- Efficiency: One report can serve dozens of accounts or teams.
- Personalization: Each user views real-time data that’s relevant to them.
- Enhanced collaboration: A single report adapts to the needs of multiple departments.
This system optimizes workflow while reducing administrative workload.
How to add and configure a Data Control
Insert the Data Control into your report
- Switch to Edit mode: This step is required to modify the report’s structure.
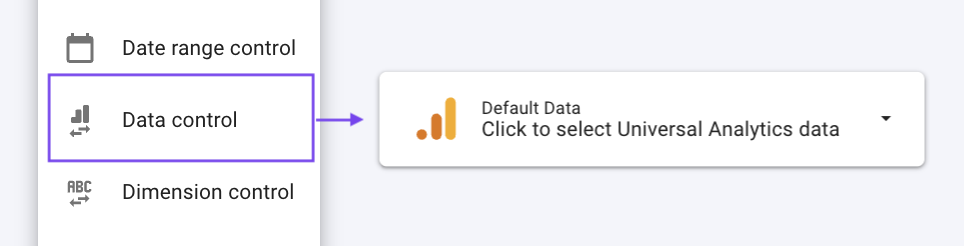
- In the top menu, click on “Add a control”: This menu offers several types of interactive controls.
- Select “Data Control” from the list.
- Place it where you want in the report layout.
- The Properties panel opens on the right, allowing you to configure the connector type and scope. This panel also includes all customization options.
Selecting the Connector Type
In the Properties panel, choose the connector type from the dropdown menu: Google Analytics (Universal and GA4), Google Ads, YouTube, Search Console, Campaign Manager 360, Attribution 360, or Google Ad Manager. The connector type determines which accounts are available based on each user’s permissions.
For instance, a Google Analytics control allows users to switch between different Analytics views they have access to. For a YouTube report, a user can switch between their channels (e.g., Marketing vs. Technical Support).
Managing Control scope (Page, Report, or Chart)
By default, the Data Control only affects the charts on the active page. To extend it to the entire report, right-click on the control and select “Make report-level.” This applies the same dataset across all pages—useful for multi-page reports.
To limit the scope to specific charts, group them with the control via the Organize menu. This allows you to display data from different accounts on the same page—ideal for sector-based comparisons (e.g., sales vs. marketing or performance by country). This flexibility supports cross-analysis needs.
How Data Control works and compatible Data Sources
How the dataset switching mechanism works
Data Control operates based on existing permissions. A user will only see the accounts their Google account already has access to, through the credentials of the data source.
When a user selects a new account through the control, the report keeps the same metrics and dimensions but applies them to the new dataset. This mechanism prevents permission errors, since only accessible datasets appear in the dropdown menu.
Be careful: if the new dataset doesn’t include some of the metrics or dimensions used in the charts, visualization errors may occur. It’s therefore essential to ensure data structure consistency when designing your report.
Using bookmarks to save and share views
User selections are stored in the URL, allowing configurations to be saved via bookmarks. This makes it possible to:
- Create shortcuts to personalized views
- Share pre-filtered reports with colleagues or clients
- Avoid duplicating reports for different datasets
For example, an analyst might save a bookmark showing performance for a specific website via Search Console. Another user with access to a different site can then generate their own bookmark for their personalized view, without altering the original report.
This feature enhances efficiency for shared reports by allowing each user to maintain their own configuration without affecting others.
Conclusion
The Data Control feature simplifies report management in Looker Studio. It allows users to change the data source without modifying the report structure, offering significant time savings and greater autonomy.
With this feature, a single report can be reused across multiple accounts, teams, or clients, while maintaining visual and structural consistency. Data Control thus becomes a key tool for centralizing, standardizing, and streamlining dashboard creation. Limitation: It’s only available for connectors developed by Google.

