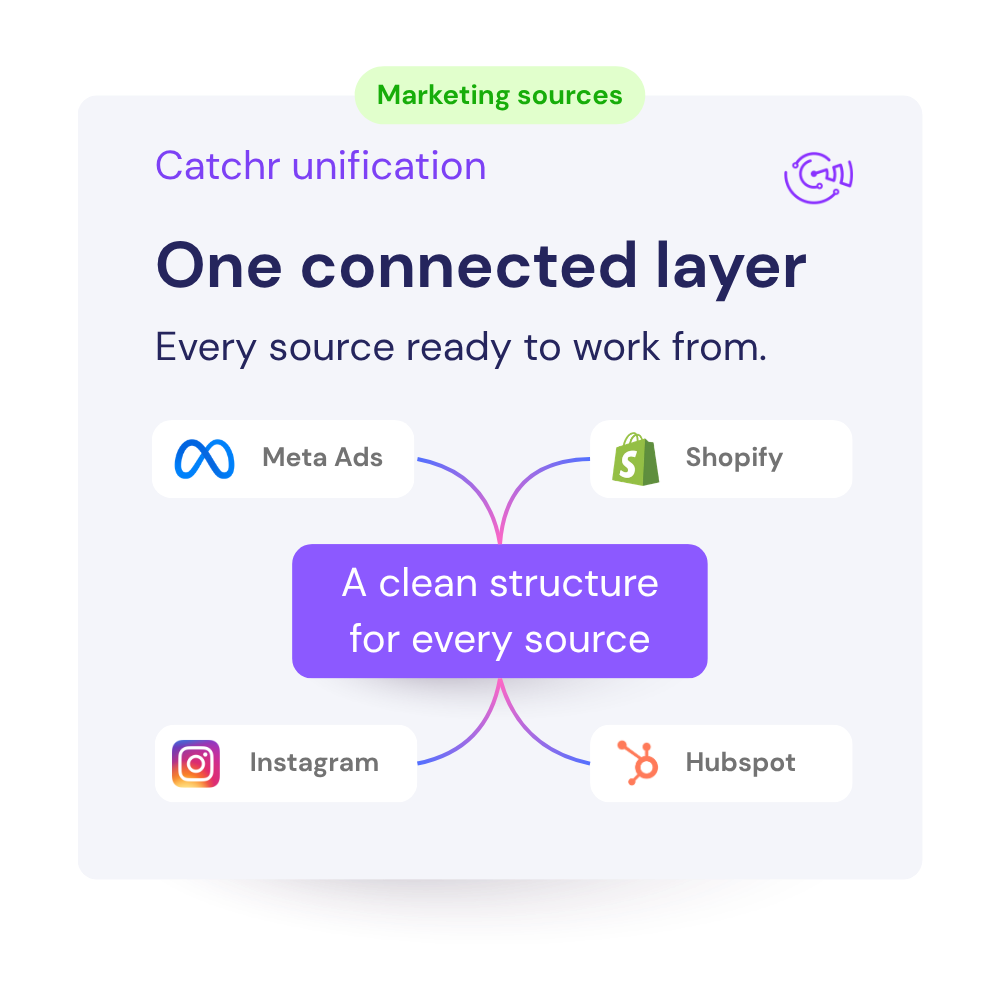
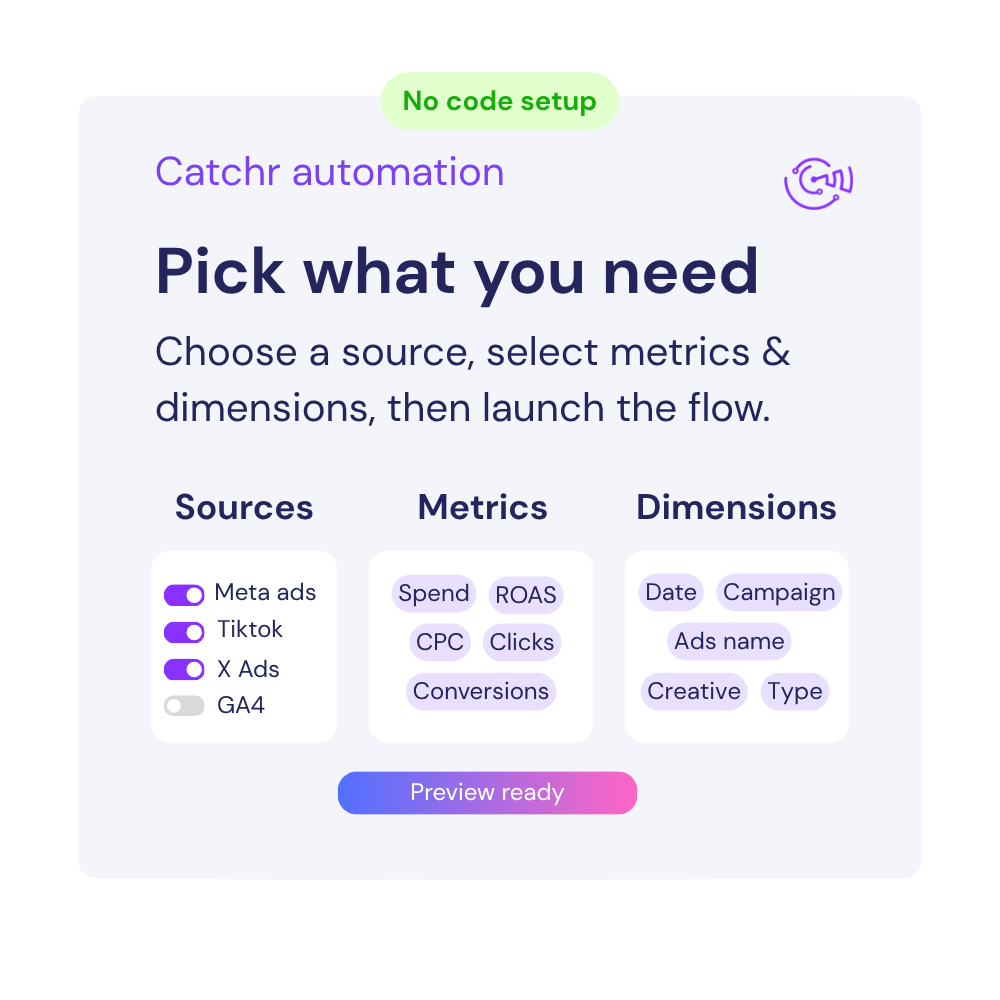
blog post

Connect LinkedIn Ads to Looker Studio : How-to, templates and metrics

Johan Chemin
November 20, 2023
Connect LinkedIn Ads to Looker Studio : How-to, templates and metrics

Quick steps to create a LinkedIn Ads report with Google Sheets:

You can easiliy create a LinkedIn Ads report following this step :

  1. Get informations from the data integration from our LinkedIn Ads connector.
  2. Create a source on catchr.io.
  3. Download our Google Sheets extensions.
  4. Configure and run your request
If you need more informations, you can follow the tutorial.

How to install Google Sheets Catchr Add-on.

To start exporting your LinkedIn Ads data to Google Sheets, you need to install the Catchr add-on. You currently have two options :

Option A: Via the marketplace:

  1. Visit the Catchr Add-on page on the Google Workspace Marketplace and click "Install."
  2. Grant the necessary permissions for the add-on.
  3. Upon successful installation, open a Google Sheets to proceed.
Connect Google Sheet to Facebook Ads
Install Catchr Google Sheets Add-on

Option B: Directly within a Google Sheets:

  1. Open a new Google Sheets.
  2. In the top menu, click "Extensions", then hover over "Add-ons" and select "Get add-ons."
  3. Search for "Catchr" and choose "Catchr - data connector."
  4. Click "Install" and grant the required permissions.
  5. Close the installation pop-up when completed.
  6. Start using the Catchr add-on.
Install Catchr Add-on for Google Sheets

Once you have installed the add-on, you can start making requests.

The tutorial

Quick steps to create a LinkedIn Ads report with Looker Studio:

You can easiliy create a LinkedIn Ads report following this step :

  1. Get informations from the data integration from our LinkedIn Ads connector.
  2. Create a datasource and new report on Looker Studio.
  3. Choose your metrics and dimensions.
  4. Use charts with your metrics and dimensions.
If you need more informations, you can follow the tutorial. You can also find a template for LinkedIn Ads at the end of the page.

The tutorial

Quick steps to create a LinkedIn Ads report with PowerBI:

You can easiliy create a LinkedIn Ads report following this step :

  1. Get informations from the data integration from our LinkedIn Ads connector.
  2. Create a source on catchr.io.
  3. Configure your request on the PowerBI request manager.
  4. Copy the given URL in PowerBI
If you need more informations, you can follow the tutorial. You can also find a template for LinkedIn Ads at the end of the page.

The tutorial

Welcome to this step-by-step guide where we'll walk marketing professionals through the integration process of connecting their LinkedIn Ads account with Looker Studio, formerly known as Google Data Studio. By the end of this guide, you'll be equipped to create insightful, visual reports by harnessing the rich analytics from LinkedIn Ads within Looker Studio's dynamic environment.

How to connect your LinkedIn Ads account to Looker Studio

Create an Account on Looker Studio

To initiate your data visualization journey, establish an account with Looker Studio. For existing Google users, the process is streamlined: your regular Google credentials pave the way for access to Looker Studio.

Looker Studio Account Creation

Connect LinkedIn Ads to Looker Studio

  • Navigate to your Looker Studio dashboard and select "Create" to begin.
Create a New Report in Looker Studio
  • From the drop-down, choose "Report."
Select Report Option
  • Peruse the data source gallery and pinpoint the Catchr LinkedIn Ads data connector.
Locating Catchr Connector for LinkedIn Ads

Authorization Process Walkthrough

If this is your first time eliciting authorization for this connector:

  1. Come to grips with authorizing the connection to both Looker Studio and Catchr. Let's elaborate on this process:
Authorizing Looker Studio Connection
  1. Elect the Google Account intended for connection.
Google Account Selection
  1. Review the authorization necessities for Looker Studio and proceed by scrolling downwards.
Authorization Necessities Review
  1. Consent to grant access.
Granting Access to Looker Studio
  1. Your Google Account has now been authorized for Looker Studio use. But there's more—we must now permit the Looker Studio connector to tap into Catchr's data from your LinkedIn Ads.
  2. Clink on the subsequent 'Authorize' button, displayed beneath "LinkedIn Ads requires authorization to connect your data to Looker Studio."
Connector Authorization for LinkedIn Ads
  1. A window will unveil detailing the steps to authorize Catchr to interact with your LinkedIn Ads data—follow these for a seamless setup.
Catchr Authorization Instructions
  1. Subsequent to a brief loading period, revisit the prior page and descend to pinpoint the account for Catchr access.
Returning to Authorization Page
  1. Choose the account to link and click "Add." If the "Add" button seems elusive, search at the top right for "Create Report" or "Report."
Finalizing Account Addition

Upon completing these steps, your LinkedIn Ads data will flow seamlessly into Looker Studio, enabling you to craft comprehensive, data-driven narratives for your marketing insights.

Unlock the Potential of LinkedIn Ads Metrics in Looker Studio

Embracing Catchr's LinkedIn Ads metrics within Looker Studio unlocks a multitude of possibilities for analyzing and presenting marketing data. Visualizing metrics like impressions, clicks, and conversions in real-time allows for a nuanced understanding of campaign performance. Imagine the impact of segmenting data by company size, industry, or job function to tailor your strategies effectively.

For example, by leveraging Device Type metrics, you can construct detailed graphs illustrating the devices your audience engages with most frequently, helping you optimize your ads for those specific platforms. Alternatively, if you're keen on user demographics, groupings based on Member Country or Seniority can deliver invaluable insights into where your content resonates the most and who it's influencing.

Each of these metrics, including daily, monthly, and yearly granularity, offers an enriched layer of detail to your marketing analysis. Not only do you gain historical insights, but also the ability to forecast trends and adjust your strategies proactively.

To explore a comprehensive list of metrics you can use with Looker Studio, click here.

How to create a report with my LinkedIn Ads data source?

You have 2 options here. You can take the blank template link and follow the tutorial with it. Or create your own report from scratch.

To do so: click the Create report button at the top right from the data source previously created. Looker Studio now creates a report where you are the owner and contains your data source. You'll find more information about the report interface on this page.

Metrics and dimensions

Now, I need to choose the essential KPIs. On my LinkedIn Ads, I'm primarily interested in the leads to my website. I want to know how many people saw one of my ads and became a visitor and how much it cost me.

Here's the list of metrics I will use:

  • Cost in Local currency -> What does it cost me?
  • Impressions -> How many times were my ads shown?
  • Approximative unique impressions -> How many people see one of my ads? (the equivalent of reach in LinkedIn Ads).
  • Click -> How many clicks on my ads?
  • One Click Leads -> How many leads were generated?
  • Landing Pages Views -> Number of times someone visits my website.
  • Cost per Lead -> What a single lead costs me?
  • Lead Conversion rate -> What percentage of people clicked on ads and became a lead?

And the breakdown I want to see:

  • Campaign -> to have the performance of the campaign.
  • Ad Creative -> to check what are the best-performing ads.
  • Job Seniority -> to know where people come from.
  • And by date -> to study the overall evolution.

How to place scorecards with my metrics?

Now that we have the metrics and dimensions list let's place them in the report.

Click on Add a chart, then Scorecard. Next, click in canvas to place this scorecard, and change the metric in the configuration panel to Impressions.

Add impression Scorecard on Looker Studio

Add a bit of style to this scorecard:

  • Increase font size.
  • Change the color label to white
  • Center the title, value, and comparison.
  • Show a 0 with empty data.
Style a scorecard in Looker Studio

Now that we set up the style for one scorecard, copy and paste it. You will keep the style with the copy and must only change the metric in the configuration panel.

Copy Scorecard and set up other metrics.

I will create calculated fields for the Cost per Lead and Leads Conversion Rate like this : 

  • Go to change the metric for a scorecard.
  • Instead of selecting a metric, click Add a calculated field.
  • Enter the formula.

Formula for Cost per Lead: "SUM(cost in local currency)/SUM( One Click Leads)

Formula for Lead Conversion Rate: "SUM(One Click Leads)/sum(Clicks)"

Create a calculated field in Looker Studio

And to finish this section, we will align and rename the scorecard so it looks good:

  • Place the 2 top scorecards where you want them, horizontally align. Same with the 2 bottom cards.
  • Select the four left metrics and Right-clicks on it, then Vertical Align -> and left or right. Then Distribute -> Vertically.
  • Repeat for the right column.
Align scorecard in Looker Studio

And rename some of the metrics, so the name fits better :

Rename metrics name in Looker Studio.


How to use breakdown dimensions?

Campaign breakdown in a table:

We placed scorecards with the overall metrics. Now it's time to add more charts with our chosen dimensions.

At first, I want a simple table by campaigns with my metrics. To do so:

  • Click on Add a chart, then Table. Place the table on the canvas.
Create a table in Looker Studio
  • Choose Campaign Name for dimension in the configuration panel, and add the metrics.
Choose dimension and metrics in a table
Choose dimension and metric in a table

Add all the metrics to the table.

And finally, we will modify the style of the table:

  • Remove header background
  • Increase font size.
  • Add borders
  • And resize columns.
Add style to the table

Member Seniority breakdown in pie charts:

Let's look at audiences now. A great way to display such information is a pie chart. You can quickly identify big and small audiences.

We will use the Member Seniority dimension to know the age range of our audience:

  • In Add a chart, select a pie chart and place it in the canvas.
  • In dimension, select Member Seniority. In metrics, select One-click Leads.
Add a pie chart to your report

And we can modify the style easily by copying the table and pasting only the style:

Copy the style from the table

Pie-chart does not have an automatic title. We can add one : 

Add a title to the pie chart.


Ads creative breakdown performance:

A great way to know which ads work better is to see which creative generates the most leads. Now, we already have a table for the campaign. We can re-use it:

Copy and paste the campaign table.

Change the dimension to Creative Ad Thumbnail and keep only Leads metrics.

Copy a table and add creative image

Finally, change the type of the Creative Ad Thumbnail to images to display images in your report.

Change field type to URL -> Image


Add control field in the report:

Looker Studio displays the last 28 days of data in your report by default. But you can use a Date range control to modify it live:

  • Click Add a control, then Date Range Control. Place it on the canvas.
  • Modify the color of the font.
Add a date range control in your report.

You can also add a selector to help viewers to filter the data. For example, a simple selector on the Campaign Type Objective can easily focus the report.

To do so: 

  • Click Add a control, then Date Range Control. Place it on the canvas.
Use a control field on your report


Template link and copy instructions.

You can find the complete template here.

You can quickly copy it like this:

  • Clicks on the three dots at the top right, then Make a copy.
  • If you followed this tutorial, you created a LinkedIn Ads data source with our connector. Select this data source, then click copy.
Copy and use the template with your data source

And you are ready to go!

Bonus : Your free Template LinkedIn Ads - Leads Performance Template

In this LinkedIn Ads template, you will find all the metrics and dimensions you would need to get a better view of your data.

If you need more templates, you could look at our looker studio template gallery.

Bonus : Your free LinkedIn Ads OverviewTemplate for PowerBI

In this LinkedIn Ads template, you will find all the metrics and dimensions you would need to get a better view of your data thank to our integrations.

If you need more templates, you could look at our PowerBI template gallery.

Unlock Insights with Style!

Transform your marketing data into stunning dashboards.

Integrate, visualize, and impress with Catchr's seamless dashboards. Elevate your data game now!
Build your first report
14 days free-trial - No credit card required 🎉

More blog post about LinkedIn Ads

Explore your LinkedIn Marketing Ads KPI with PowerBI : how-to, templates and metrics

Learn how to connect LinkedIn Ads to PowerBI for enhanced data visualization and analytics in this comprehensive guide, transforming LinkedIn metrics into strategic insights.

Florian Cabirol

Decoding LinkedIn Ads KPIs: A Comprehensive Guide to Boosting Conversions and CTR

LinkedIn Ads KPIs give you valuable insights into how well your ad campaigns are performing. Learn more about LinkedIn KPIs, along with the right ones to track.

Florian Cabirol

LinkedIn Ads to Google Sheets: Effortlessly Export Your Data for Enhanced Analysis

Learn how to effortlessly export your LinkedIn Ads data to Google Sheets using the Catchr Add-on for enhanced analysis, better decision-making, and improved campaign performance.

Florian Cabirol

Connect LinkedIn Ads to Looker Studio : How-to, templates and metrics

Learn how to create a LinkedIn Ads report in Looker Studio and get a free template!

Johan Chemin