Explore your Snapchat Ads KPI with PowerBI : How-to, templates and metrics

Learn how to visualize and analyze your Snapchat Ads marketing data in PowerBI with this comprehensive tutorial. Discover how to import data using Catchr, create informative dashboards, and leverage key metrics for in-depth campaign analysis, turning raw data into actionable insights for strategic decision-making.

By the end of this tutorial, you will have comprehensive knowledge on how to visualize your Snapchat Ads marketing data using PowerBI. If you follow the steps carefully, you'll be able to create vibrant and informative dashboards that turn raw data into actionable insights.

How to connect your Snapchat Ads account to PowerBI

Add a source on Catchr

To begin, navigate to the Catchr homepage and click on Source found in the left sidebar. Proceed to click on Add a Source at the top-right corner of your screen.

Identify and select the Snapchat Ads platform before completing the identification process to synchronize your Catchr and Snapchat Ads accounts.

Add Snapchat Ads Source in Catchr

Create the request to transfer Snapchat Ads data to PowerBI

  • Within Catchr, select API from the left-hand menu.
API Menu in Catchr
  • For your export format, ensure it's set to "PowerBI".
Setting Export Format to PowerBI
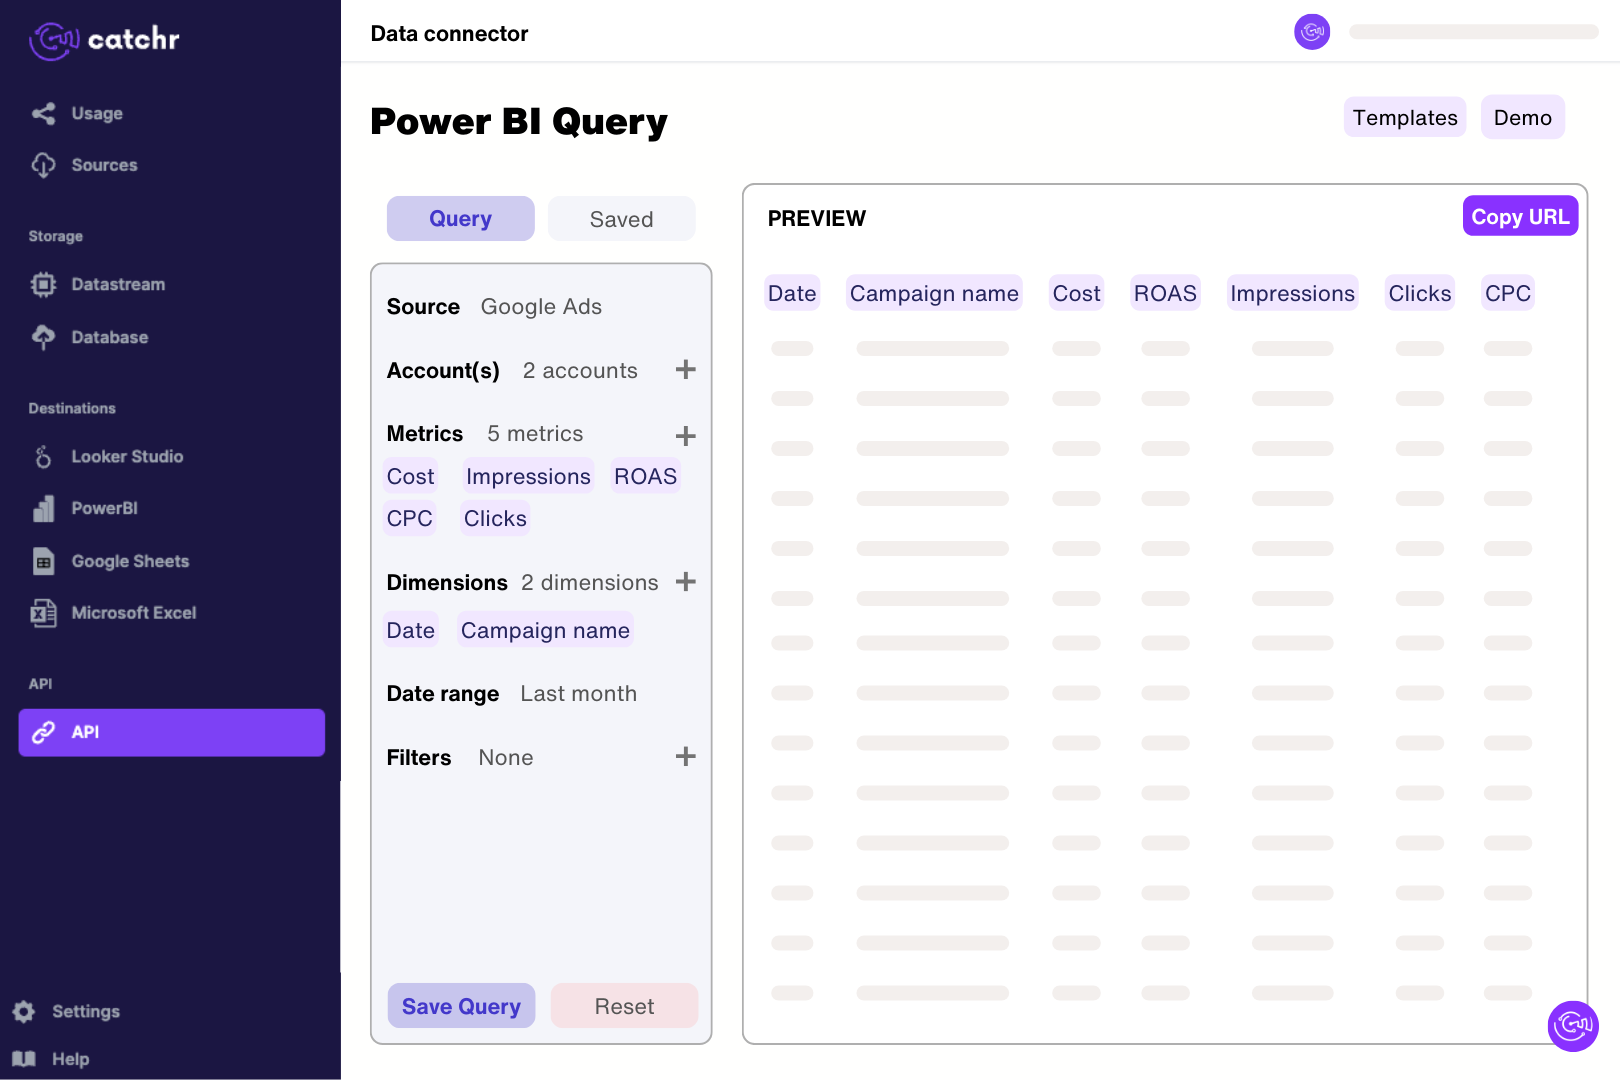
  • Under the "Source" tab, choose Snapchat Ads as the platform you want to pull data from.
Selecting Snapchat Ads as Source
  • Choose the Snapchat Ads account whose data and KPIs you're interested in exporting. There's an option to select multiple accounts if necessary.
Selecting Snapchat Ads Accounts
  • Next, pick the metrics and dimensions for your data request. Feel free to select as many as you need.
Selecting Metrics and Dimensions
Additional Metric and Dimension Selection
  • Warning: In case you are using any of Catchr's templates, make sure to select every dimension and metric as listed on the templates page. Upon doing it right, the template should automatically populate with your tailored data.
  • Specify the time period for the data extract from Snapchat Ads, choosing either a set time frame or custom dates.
Selecting Time Period
  • If applicable, add any filters to your data request to refine the results.
Adding Filters to Data Request
  • Then, include any specific options needed for the Snapchat Ads platform data request.
Setting Options for Data Request
  • With the setup complete, a URL for your data will be generated at the top of the page. If you wish, you can preview the data by clicking on "Preview".
Generated URL for Data
Data Preview
  • Copy the URL, because it will be the key to importing your Snapchat Ads data into PowerBI.
Copying Data URL

Import the Snapchat Ads data and KPI to PowerBI

In the PowerBI Desktop application, you'll be using the web data source to import your Catchr-generated data.

PowerBI Desktop

  • Navigate to Get Data, then select Web.
Selecting Web Data Source in PowerBI
  • Stay in the basic mode and paste the data request URL you've copied from Catchr.
Pasting the Request URL in PowerBI
  • Click OK and wait as PowerBI imports the data. This process might take a few minutes.
  • After importation, apply any additional filters or edits with PowerBI Query Editor and start crafting your customized dashboard. Once satisfied, publish and share your dashboard with your necessary contacts.'

PowerBI Web App

Publish your dataset from PowerBI Desktop to use it in the PowerBI Web App. You can then access your reports and data sets online, enabling further analysis and report creation straight from your web browser.

As a final touch, bear in mind that by following these instructions, you're not just simplifying your data analysis process, but also capitalizing on the capability of PowerBI to combine disparate data sources into a coherent whole, hence allowing for more comprehensive strategic decisions.

Example of metrics you can use with the PowerBI Integration for Snapchat Ads

With PowerBI integration for Snapchat Ads, courtesy of Catchr, marketers can tap into a vast array of metrics to gauge their campaign's performance. Here’s how you might leverage some of these metrics:

  • Spend and Impressions: Visualize your spending next to the number of impressions to gauge the efficiency of your ad spend.
  • Swipe-Up Rate: Create a detailed analysis of which ads drive the most engagement by comparing swipe-up rates.
  • Conversion Events: Determine ROI by correlating specific user actions, such as app installs or purchases, with their associated costs.

For a comprehensive list of all the fields available for your PowerBI reports, visit this detailed metric listing. This will provide you with the necessary data points to not only reflect past performance but also to predict future trends and prepare strategies accordingly.

Keep Reading.

More practical ways to make reporting easier to trust and faster to act on.

Better reporting starts with better questions.

Get practical guides, new templates, and product ideas for making marketing data easier to use.

14 days free-trial
No credit-card required
100+ sources