Starter
For freelancers and small teams.
$ 24 /mo
Billed monthly · cancel anytime
Platforms3
Accounts10
.svg) Google Merchant Center query · Power BI format
Google Merchant Center query · Power BI format
 Google Merchant Center
One source
Google Merchant Center
One source
 Saved query
API URL
Power BI
Web · Import
Saved query
API URL
Power BI
Web · Import
Used by the world's leading companies









Available metrics
Available dimensions
Google Merchant Center
3 advertising accounts
Connected
 Google Ads
2 advertising accounts
Connected
Google Ads
2 advertising accounts
Connected
 Google Analytics 4
1 web property
Connected
Google Analytics 4
1 web property
Connected
 HubSpot
1 CRM portal
Connected
HubSpot
1 CRM portal
Connected

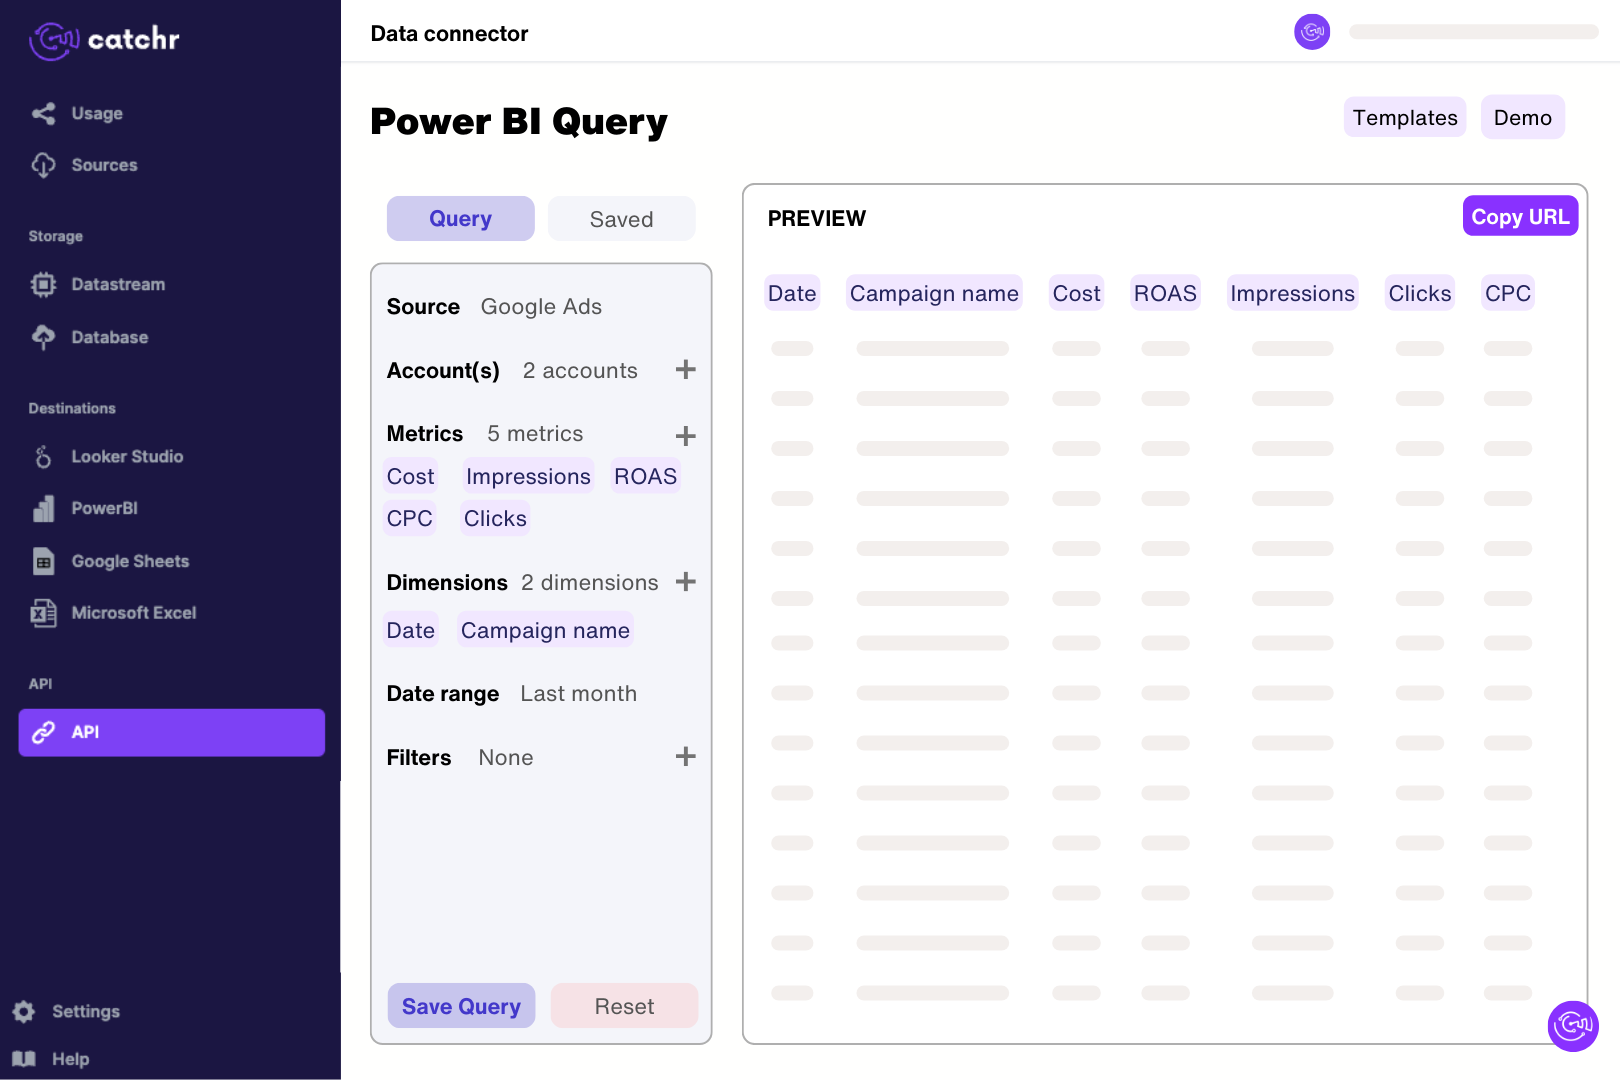
Authorize Catchr with a Google user who can access the Merchant Center account. In Catchr’s Power BI query builder, select product performance and a separate table of product issues and preview a short extraction. Import the generated URL through Get data > Web in Power BI Desktop. Check the returned rows before building measures, keeping account, offer, country and language when identifying products clear in the model.
Catchr exposes product clicks, impressions, CTR, conversions, and conversion value where available, together with product attributes and status information. Fields such as offer ID, brand, category, custom labels, country, and marketing method help organize the report. Performance, product status, and pricing insights are different reports and may not support every field combination.
Yes. The marketing-method field distinguishes ADS from ORGANIC in the performance data returned by Merchant Center. Use it to keep paid and organic results separate. Product eligibility also has a reporting context, such as Shopping ads or free listings; eligibility and recorded performance answer different questions.
Yes. The connector includes product and account issues, affected attributes, severity, countries, and reporting destinations. Review the country and destination before interpreting a disapproval: a product can be eligible in one context and restricted in another. Count distinct products when measuring affected inventory because one product can have several issues.
No. Price insights include suggested prices and predicted changes in clicks, impressions, or conversions. These are estimates, not results that have already happened. Keep predictions separate from measured performance and consider your margin, currency, and commercial constraints before using them to guide a pricing test.
Check the account, date range, country, marketing method, and product identifiers first. A product-issue table can contain multiple rows for one product, while performance is grouped by the dimensions requested. Avoid joining those rows directly to sales or clicks without aggregation, which can multiply totals. Also compare the same conversion measure in both reports.
Yes. Add Google Ads to compare product visibility or eligibility with advertising costs. Validate product identifiers, account scope, country, and currency before creating relationships. Offer ID alone may not uniquely identify a product across feeds or markets, so test the mapping before calculating product-level efficiency.
Our team is always here to answer any questions you may have about our data connector.
Connect your marketing platforms and build a data workflow your entire agency can use.





.svg)




























.png)




.svg)