
Prepare data before every question.
- Export files from the marketing platform
- Reformat and reconcile columns
- Rebuild the analysis for each follow-up









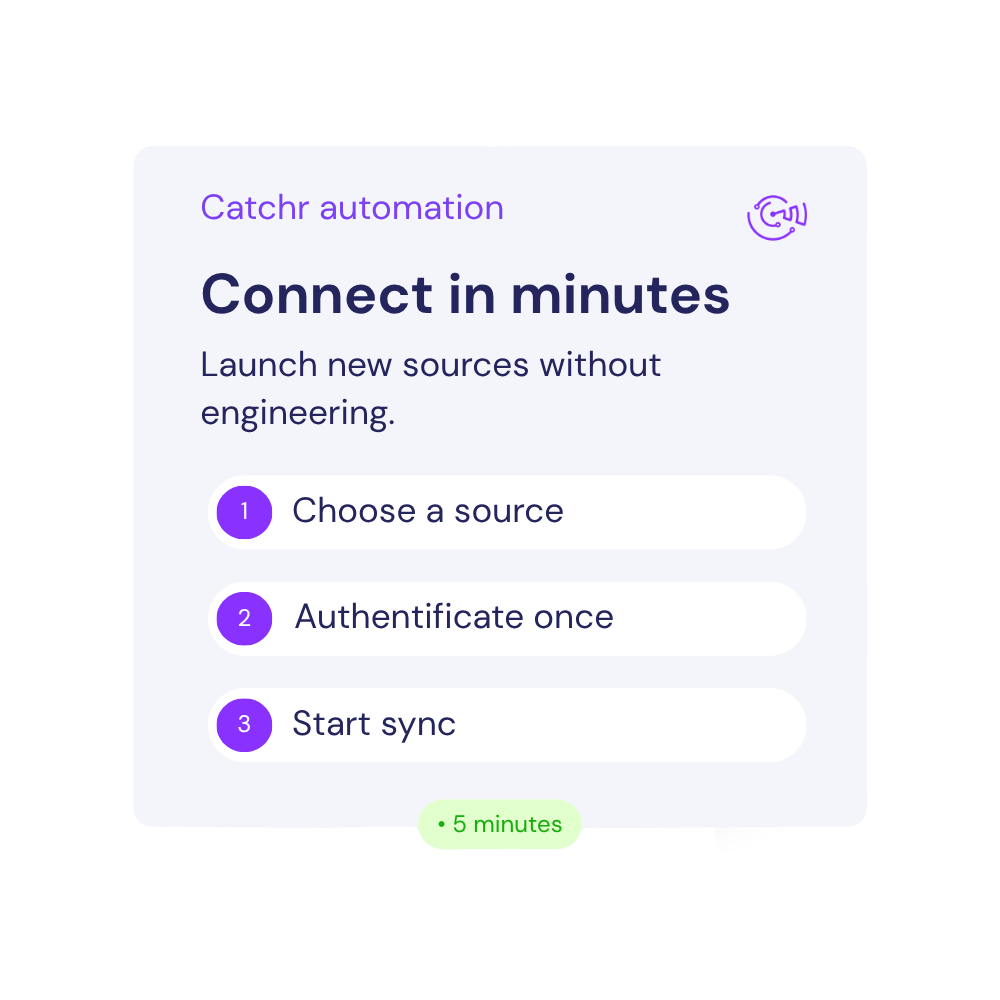
Three steps to your first source-aware prompt.
 Meta Ads
3 advertising accounts
Connected
Meta Ads
3 advertising accounts
Connected
 Google Ads
2 advertising accounts
Connected
Google Ads
2 advertising accounts
Connected
 Google Analytics 4
1 web property
Connected
Google Analytics 4
1 web property
Connected
 HubSpot
1 CRM portal
Connected
HubSpot
1 CRM portal
Connected

Configure the Catchr remote MCP connection in ChatGPT using the connector details from Catchr.
Replace account, period, KPI target, and threshold variables before you ask ChatGPT.

“Why did CPA rise?” sounds simple. The answer is usually buried across exports, formulas, filters, and tabs before the analysis can even start.
Choose the right account, date range, breakdowns, and fields. Then wait for the file and do it again when the question changes.
Rename columns, fix formats, join tabs, and check formulas before you can trust the comparison.
Turn the numbers into a client-ready answer, then repeat the whole process for the inevitable follow-up.
Catchr MCP gives ChatGPT access to the marketing accounts you select, so each follow-up starts with the same marketing context instead of a new manual export.
Choose your role, open a workflow, then replace the bracketed variables before pasting the prompt into ChatGPT. Every prompt asks for evidence, limits, and a concrete output.
Clear answers for marketers comparing connectors, data sources, reporting workflows, and dashboard setup.
ChatGPT can query connected Google Display & Video 360 data for campaign delivery, spend, conversion, and revenue reporting.
Representative measures include Total Conversions, Click Rate (CTR), Post-Click Conversions, Post-View Conversions, and Media Cost eCPM (Advertiser Currency). Useful breakdowns include Campaign, Advertiser, Date, Country, and YouTube Ad Group. The exact field set depends on the selected dataset and compatible reporting reporting level.
The available detail depends on the fields returned for the selected dataset. Useful breakdowns include Campaign, Advertiser, Date, Country, and YouTube Ad Group.
Ask ChatGPT to state the reporting level it used and keep incompatible levels separate before calculating totals, rates, or comparisons.
Yes. ChatGPT can rank campaigns, products, audiences, or placements against your efficiency and volume targets. Relevant fields include Total Conversions, Click Rate (CTR), Post-Click Conversions, Post-View Conversions, and Media Cost eCPM (Advertiser Currency).
Set the business target, comparison period, and minimum volume before requesting priorities or recommendations.
Yes. ChatGPT can isolate the campaign, creative, audience, placement, product, or search term behind a performance change. Useful breakdowns include Campaign, Advertiser, Date, Country, and YouTube Ad Group.
Ask it to separate observed data, possible explanations, and the next validation step so an unusual value is not presented as a proven cause.
Strong prompts name the action, account or entity, date range, comparison, and KPI or threshold.
Yes, when the other sources are also connected to Catchr. Useful combinations include analytics, commerce, CRM, or other advertising sources.
Align dates, currencies, identifiers, and definitions first. If the sources cannot be joined reliably, ask for a side-by-side comparison rather than a single attributed result.
Yes, provided each one is connected and available through Catchr MCP. Ask for separate results first, then create the combined view.
Specify the currency, timezone, objective, attribution window, and KPI target. This keeps one large entity or a definition mismatch from distorting the comparison.
You need access that can authorize and view the relevant Google Display & Video 360 data, a Catchr workspace with the source connected, and Catchr MCP enabled in ChatGPT.
After selecting the required entities, you can ask questions in natural language without preparing a new CSV export for each analysis.
ChatGPT analyzes the records returned through the connected Catchr source; it should not assume the data is real time. Freshness and historical coverage can vary by dataset, field, selected period, and source API limits.
Ask it to state the latest campaign or reporting date and the attribution window used, together with the timezone, requested period, and any missing intervals before interpreting a trend.
No. Catchr MCP provides Google Display & Video 360 data for analysis; it does not give ChatGPT permission to change campaigns, bids, budgets, targeting, or ads.
Use the result to prepare an action plan, then make operational changes in Google Display & Video 360. Review the supporting figures before acting on the recommendation.
Catchr MCP is included in every standard plan—there is no separate fee for the ChatGPT integration. The Starter plan begins at $20 per month when billed annually, or $24 when billed monthly.
It includes 3 platforms, 10 accounts, unlimited users, and unlimited requests. Larger plans increase the number of platforms and accounts available. See Catchr pricing
Yes. Catchr offers a 14-day free trial with no credit card required.
You can use the trial to connect your marketing sources, authorize Catchr MCP in ChatGPT, and test questions using your own data before subscribing.
Our team is always here to answer any questions you may have about our data connector.
Connect yout marketing platform to ChatGPT with Catchr MCP and start investigating current campaign performance.