Reshape marketing data with pivot and unpivot in Power Query
Learn how to use pivot and unpivot in Power Query to reshape marketing data, fix common export issues, and build scalable Power BI dashboards.
Many marketing datasets are designed to be read in spreadsheets, not analyzed in BI tools. Metrics are often spread across columns, values are embedded in headers, or structures change depending on the export. While this works for manual review, it quickly becomes a limitation in Power BI.
Pivot and unpivot are Power Query transformations that help reshape data into a structure that works better for analysis, filtering, and scalable dashboards. In this article, we’ll explain what pivot and unpivot do, when to use them, and how they apply to common marketing use cases.
When data needs to be reshaped in Power BI
A dataset usually needs reshaping when its structure makes analysis rigid or fragile. Typical signals include:
- Metrics spread across multiple columns
- Repeating patterns in column names
- Values encoded in headers instead of rows
- New metrics appearing over time
These patterns are common across marketing data, whether it comes from advertising platforms, analytics tools, SEO exports, or CRM systems. Power BI works best when data follows a consistent, “analysis-ready” structure, and that’s where pivot and unpivot come in.
Pivot and unpivot explained in simple terms
Pivot: turning rows into columns
Pivot takes values from rows and turns them into columns. It’s useful when a column contains repeated categories and you want one column per category.
This transformation is helpful in specific cases, but it’s generally less common in marketing reporting than unpivot.
Unpivot: turning columns into rows
Unpivot does the opposite. It takes multiple columns and turns them into rows, usually creating:
- one column for the metric name
- one column for the metric value
This structure is far more flexible for filtering, comparisons, and scaling dashboards as new metrics are added.
For example, this dashboard uses an unpivoted dataset, allowing the same visuals to work for multiple metrics by simply changing the selected metric.
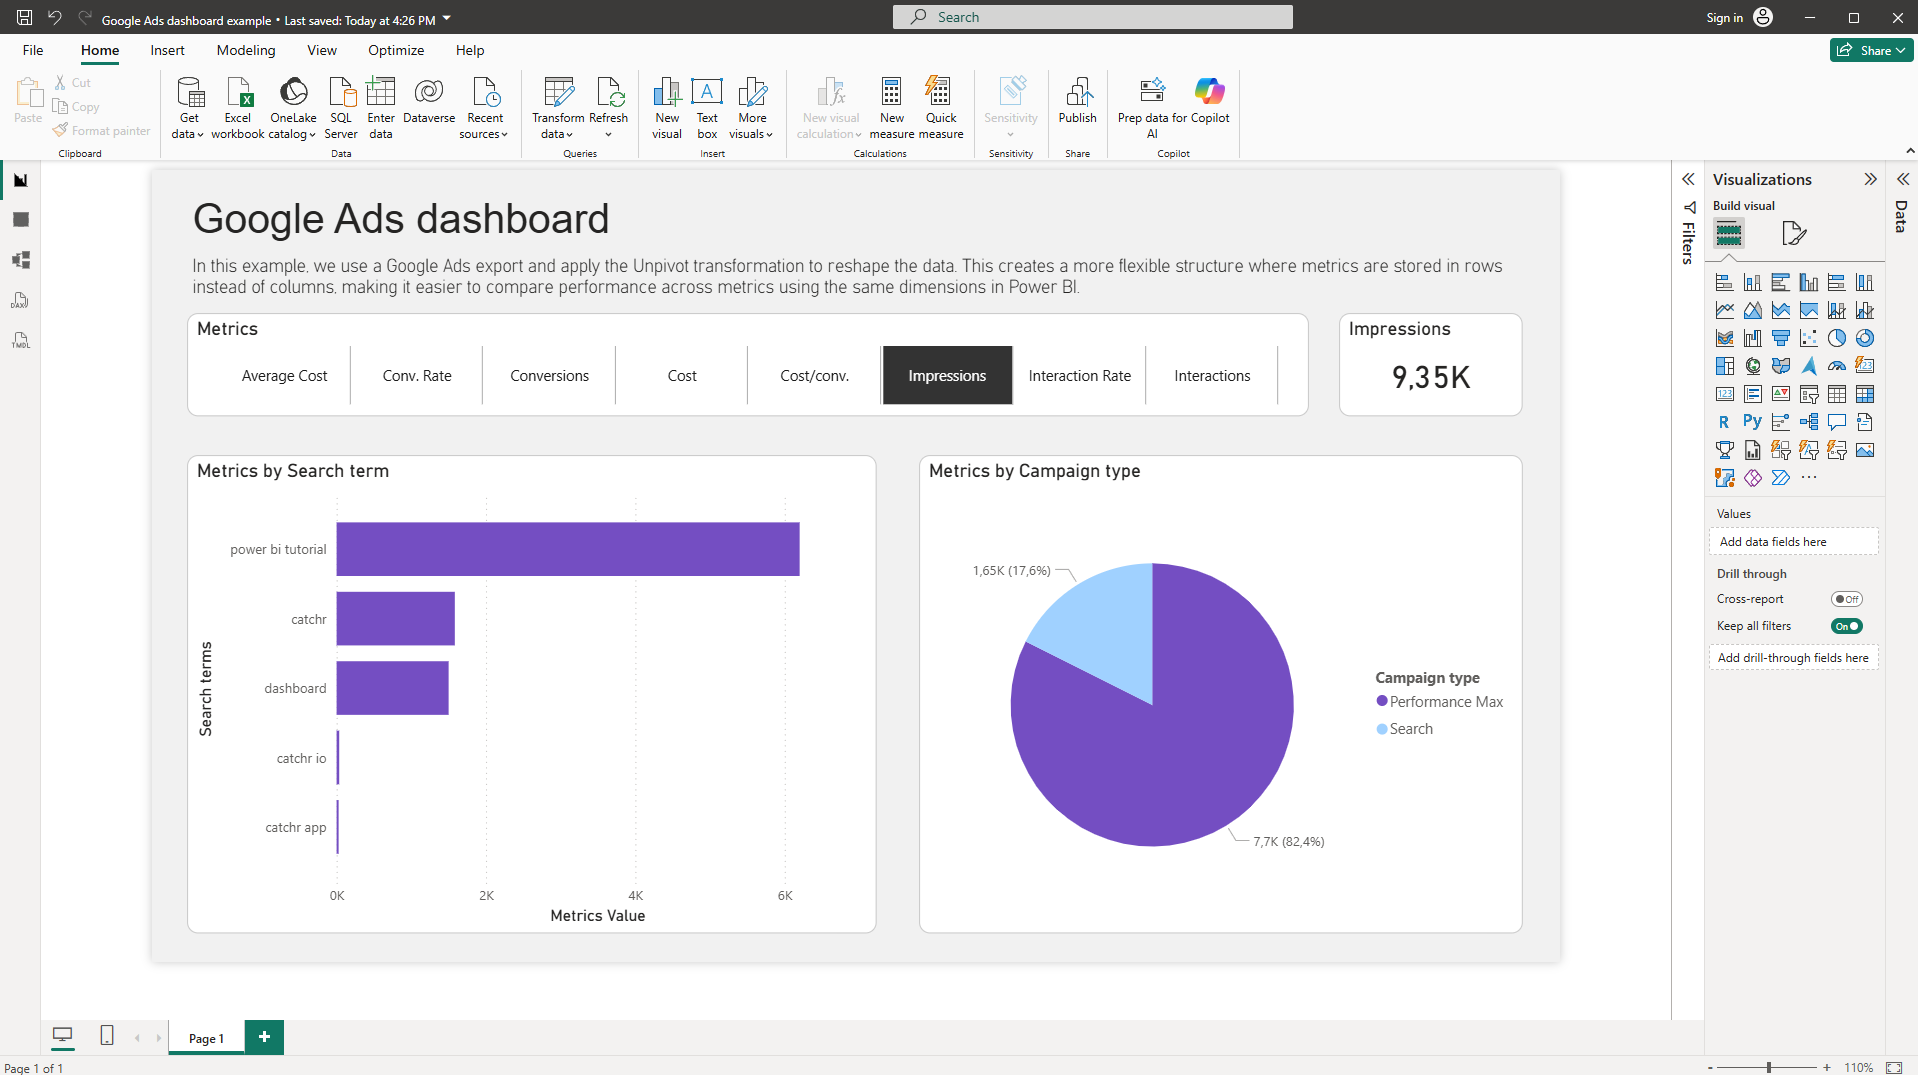
The data structure may look less intuitive in Power Query, but it unlocks simpler, more scalable dashboards in Power BI.
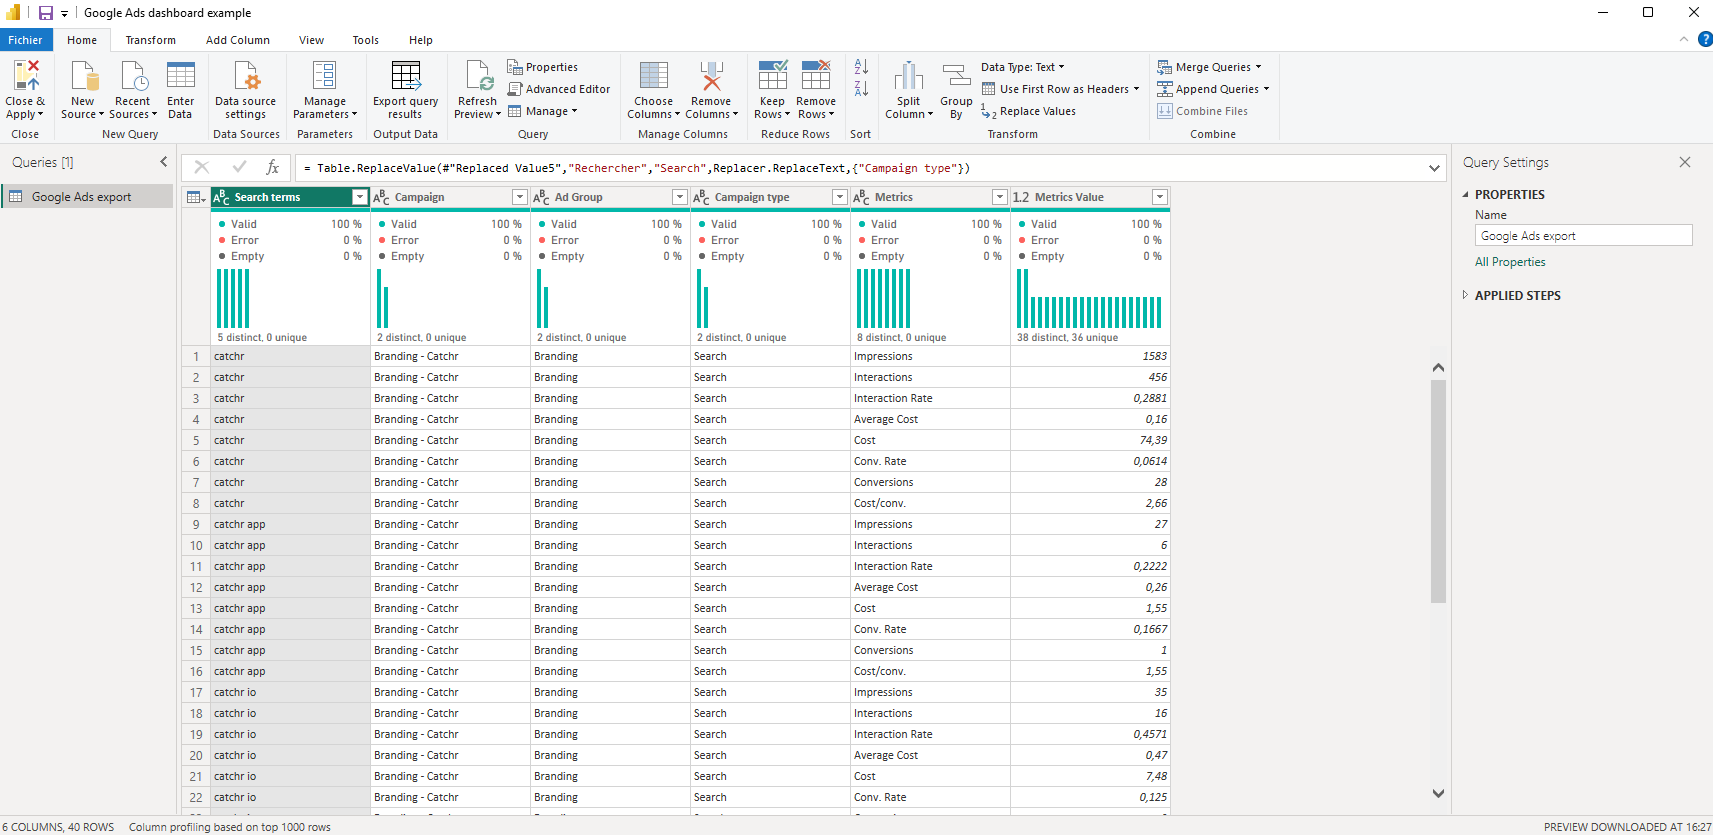
How to reshape data with pivot and unpivot in Power Query
At a high level, reshaping data follows a simple process:
- Select the columns you want to reshape
- Choose Pivot or Unpivot in Power Query
- Rename resulting columns clearly
- Validate the structure before loading
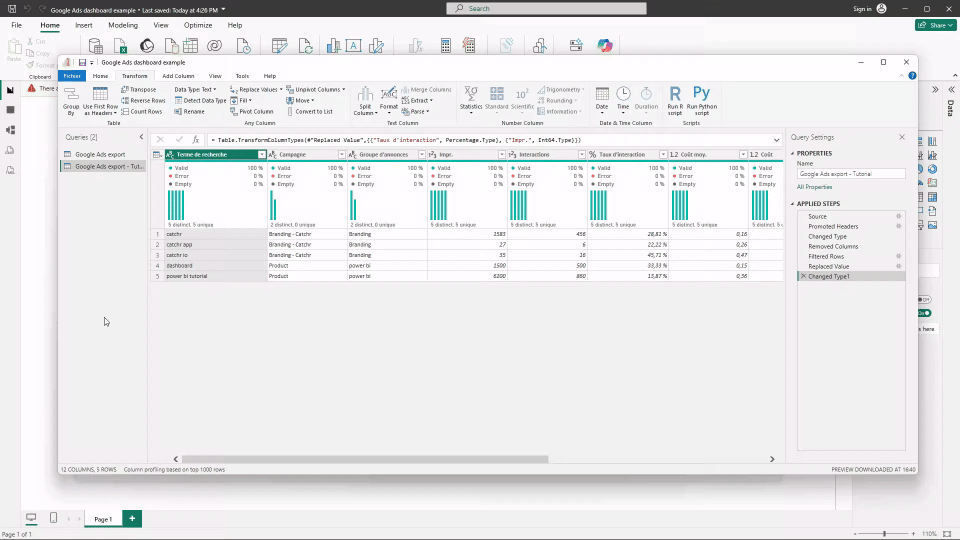
Generally, you select the metric columns so that each row represents a combination of dimensions, a metric type, and a metric value.
Reducing the need for reshaping with prepared marketing data
Many pivot and unpivot transformations are needed because marketing platforms export data in formats designed for spreadsheets, not for BI tools. An alternative approach is to receive data that is already structured for analysis.
Tools like Catchr extract data directly from marketing platforms and deliver it to Power BI in an analysis-ready format. Metrics are already normalized, consistently structured, and ready to be used in dashboards, which reduces or even eliminates the need for manual reshaping with pivot or unpivot. This allows marketers to focus on analysis and reporting rather than data preparation, while still benefiting from automated refresh and scalable datasets. Try Catchr for free
Common marketing use cases for pivot and unpivot
In marketing reporting, pivot and unpivot are especially valuable for advertising platform exports. Each ad platform comes with its own set of metrics, and those metrics are not always consistent from one platform to another.
By unpivoting performance data, metrics are stored in a single, standardized structure instead of fixed columns. This makes it possible to handle a wide variety of metrics dynamically, adapt to platform-specific differences, and build dashboards that remain simple, scalable, and easy to interpret without having to redesign visuals every time a new metric or platform is added.
Common reshaping mistakes to avoid
A few mistakes are very common when starting out:
- Pivoting data when unpivot was needed, or the opposite
- Unpivoting identifier columns instead of metric columns
- Forgetting to rename metric and value columns
- Mixing reshaping logic with KPI calculations
Keeping reshaping focused on structure makes the rest of the reporting process much easier.
Conclusion
Pivot and unpivot are general-purpose Power Query transformations that solve a wide range of marketing data problems. Advertising exports are just one common example, but the same logic applies to SEO, analytics, CRM, and other datasets. Once marketing data is reshaped into an analysis-ready format, Power BI dashboards become more flexible, more scalable, and easier to maintain over time.
.svg)