Blog post
Marketing Dashboard
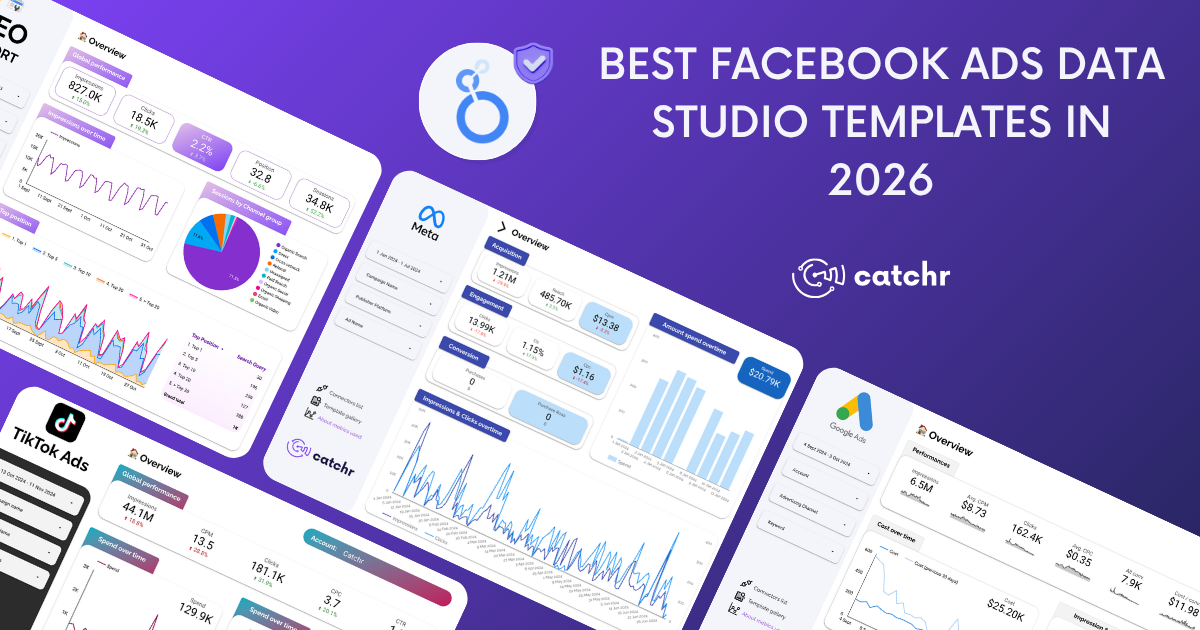
Facebook Ads (Meta Ads)

Facebook. The undeniable, indisputable, and ever-growing giant of digital marketing. Year after year, Facebook continues to be a top platform for businesses to reach their target audiences and achieve their goals—whether it’s brand awareness, customer acquisition, or sales.
You can’t deny the power of Facebook Ads. But you also can’t ignore the importance of monitoring and measuring your campaigns to understand where you’re succeeding and where you need to adjust. That’s why having the right tools for your Facebook Ads report is essential.
In this blog post, we’ll cover the top tools you need to use for your Facebook Ads report in 2023. We’ll dive into everything from the Facebook Ads Dashboard to Looker Studio Reports, Google Sheets, and more. By the end, you’ll have a better understanding of how these tools can help you track your campaigns, analyze performance data, and optimize your ad spend for success.
Let’s get started!
A Facebook Ad Report is a snapshot of your ad campaign’s performance that helps you identify what’s working, what’s not, and where you can make improvements. Facebook Ad Reports help you get better results from your ad spend by giving you key metrics and insights about your audience and ad creative.
In addition to providing an overview of your campaign's performance, Facebook Ad Reports can help you better understand your audience. By examining demographic information like age, gender, and location, you can gain a clearer picture of who is engaging with your ads and modify your targeting approach accordingly.
Facebook Ad Reports can also show you key metrics on your ad creative, such as impressions, click-through rates (CTR), and cost per acquisition. This data helps you identify which pieces of content resonate with your target audience, so you can create more effective ads in the future.
Make your ad spend more efficient, track the results of your campaigns, and make smart decisions with the help of a Facebook Ads Report. Alone, this user-friendly report is capable of delivering great insights for you, but if you harness its true potential by integrating it with other tools listed below, the results can be staggering.

The Facebook Ads Dashboard is a tool that lets advertisers see how their Facebook ad campaigns are doing. It is a central hub that shows data and insights about how ads perform, how engaged audiences are, and how much money is spent on ads. The dashboard shows data in real time, so advertisers can see how well their campaigns are doing and make changes as needed.
The Facebook Ads Dashboard can be changed to show the metrics that are most important to an advertiser's campaign. Here are a few key performance indicators that you can view in the dashboard:
This is a very useful tool for marketers because it lets them track how well their campaigns are doing and make smart decisions about how to improve them. With the data in an easy-to-use dashboard, advertisers can quickly figure out which ads work great and don't need any changes, and which ones need to be tweaked or even thrown out.
Also, the Facebook Ads Dashboard has a number of ways to target, set a budget, and bid so that promotions reach the right people and meet all of the goals that were set before they started.

Google Analytics is a powerful tool that can help you measure how well your Facebook Ads campaigns are doing. Here are some ways to get the maximum benefit from this powerful software:
With Google Sheets, advertisers can easily and quickly track how well their Facebook Ads campaigns are doing. When the two platforms work together, it's easy for marketers to get useful data from their social media accounts and use it to make complete reports or analyze the data in an organized way.
Facebook ads and Google Sheets can be integrated, eliminating the tedious task of manual data entry and drastically reducing errors. This automation process saves time while providing accurate results that allow advertisers to focus on other parts of their business.
By employing Facebook Ads and Google Sheets, advertisers gain access to an array of data related to their ad campaigns. This includes key performance indicators such as impressions, clicks, and conversions, which can be conveniently visualized in helpful graphs and charts for easy analysis. These insights allow marketers to rapidly spot trends and patterns that could help improve future results.
The best part? Google Sheets makes sharing performance data with teams, stakeholders, or external partners easy. This helps streamline the reporting process, while allowing everyone to be on the same page.
We know that integrating your Facebook Ads campaigns with Google Sheets can be a lot of work. After all, both platforms require a certain degree of technical know-how. That’s why Catchr was created—to make this process much easier and more automated.
At Catchr, we understand the value of efficiently gathering and analyzing data from different sources. We streamline this process for marketers who want to integrate their Facebook Ads campaigns with Google Sheets.
Our tool lets users quickly set up automated connections between multiple platforms, including Facebook Ads, Google Sheets, and more. With Catchr, you can easily import data from different sources and manipulate it to create valuable insights and reports.
Check out our website to learn more about how to set up Facebook ads in Google Sheets with Catchr. Now, you can save time and focus on building better reports. Get all your marketing data in one click—and ensure it’s always kept up to date.

Looker Studio is a revolutionary tool that helps businesses gain insight into their Facebook advertising results. This data visualization platform features powerful exploration, reporting, and dashboarding capabilities to uncover what drives the most success with your campaigns. Looker Studio Report for Facebook Ads integration makes it simple for users to access their data from the comfort of the platform, offering unparalleled convenience in terms of time and effort.
The Facebook Ads Looker Studio Report allows businesses to create custom reports that provide insights into their ad performance. Similar to other tools on this list, these reports can be used to track metrics such as reach, impressions, clicks, conversions, and more.
The reports can be customized to display the data in diverse formats, including tables, graphs, and charts. This makes it easy for businesses to understand their advertising performance and make data-driven decisions to improve their campaigns.
Businesses can not only make custom reports, but they can also make custom dashboards that give a high-level look at how their ads are doing. These dashboards can be shared with team members and stakeholders, allowing everyone to stay up-to-date on the performance of the company’s Facebook advertising campaigns.
Catchr makes it easier than ever to set up Facebook ads with Looker Studio. Our automated solution lets you quickly connect your data sources and create custom reports and dashboards in minutes. Catchr streamlines the process by eliminating manual data entry, ensuring that your reports are always accurate and up-to-date.
Your data is beautiful, and we make it easy to unlock its power with Looker Studio. With our integrations, you can easily sync your data from Facebook Ads into a custom Looker Studio report. Say goodbye to tedious copy-and-paste tasks and start leveraging the insights that lie within your data.
Try Catchr today and see how easy it is to set up Facebook ads Looker Studio Reports! Our intuitive platform will help you get the insights you need in no time.
You don’t know what you don’t know—until Catchr helps you find it. Our automated solution allows businesses to quickly set up reporting for Facebook Ads into Google Sheets or Looker Studio with ease, enabling them to better understand their advertising performance and make data-driven decisions that can help take their campaigns to the next level.
In the future, we will also add PowerBI, Microsoft Excel, and Tableau to the services we offer. We love to stay up to date on the latest technology, so make sure to check in with us regularly.
Don’t let your data go to waste. Instead, sign up for a free trial of Catchr today and see what you’ve been missing out on. With our intuitive platform, you’ll be able to easily make sense of your data and unlock the insights that lie within it.
✔ 14 days free trial — No credit-card required


✔ 14 days free trial — No credit-card required
.png)