Blog post

The different types of charts & visualizations in Power BI

Marketing Dashboard

Power BI

Camille Fournillier
August 18, 2025
| Lastest update
August 20, 2025

Quick steps to create a report with Google Sheets:

You can easiliy create a report following this step :

  1. Get informations from the data integration from our connector.
  2. Create a source on catchr.io.
  3. Download our Google Sheets extensions.
  4. Configure and run your request
If you need more informations, you can follow the tutorial.

How to install Google Sheets Catchr Add-on.

To start exporting your data to Google Sheets, you need to install the Catchr add-on. You currently have two options :

Option A: Via the marketplace:

  1. Visit the Catchr Add-on page on the Google Workspace Marketplace and click "Install."
  2. Grant the necessary permissions for the add-on.
  3. Upon successful installation, open a Google Sheets to proceed.
Connect Google Sheet to Facebook Ads
Install Catchr Google Sheets Add-on

Option B: Directly within a Google Sheets:

  1. Open a new Google Sheets.
  2. In the top menu, click "Extensions", then hover over "Add-ons" and select "Get add-ons."
  3. Search for "Catchr" and choose "Catchr - data connector."
  4. Click "Install" and grant the required permissions.
  5. Close the installation pop-up when completed.
  6. Start using the Catchr add-on.
Install Catchr Add-on for Google Sheets

Once you have installed the add-on, you can start making requests.

Quick steps to create a report with Looker Studio:

You can easiliy create a report following this step :

  1. Get informations from the data integration from our connector.
  2. Create a datasource and new report on Looker Studio.
  3. Choose your metrics and dimensions.
  4. Use charts with your metrics and dimensions.
If you need more informations, you can follow the tutorial. You can also find a template for at the end of the page.

Quick steps to create a report with PowerBI:

You can easiliy create a report following this step :

  1. Get informations from the data integration from our connector.
  2. Create a source on catchr.io.
  3. Configure your request on the PowerBI request manager.
  4. Copy the given URL in PowerBI
If you need more informations, you can follow the tutorial. You can also find a template for at the end of the page.

Power BI is a highly intuitive tool that offers a wide range of visuals to help you analyze your data effectively. With a simple drag-and-drop, you can start visualizing your most important KPIs right away. But if you’re here, you’re probably wondering: what is the best visualization to highlight your data? You’re in the right place!

We’ll explore the best charts and visuals available in Power BI, how they work, and when they’re most useful for you.

Power BI visuals list

Power BI offers a wide variety of visuals, and often a single type can be presented in multiple chart formats. To keep things simple and focused on what really matters, we’ll group the charts by type and explain the purpose of each. We won’t go into every single variation, except for specific cases where it truly adds value, since most alternatives simply provide another way of visualizing the same data for the same objectives.

Bar and Column charts

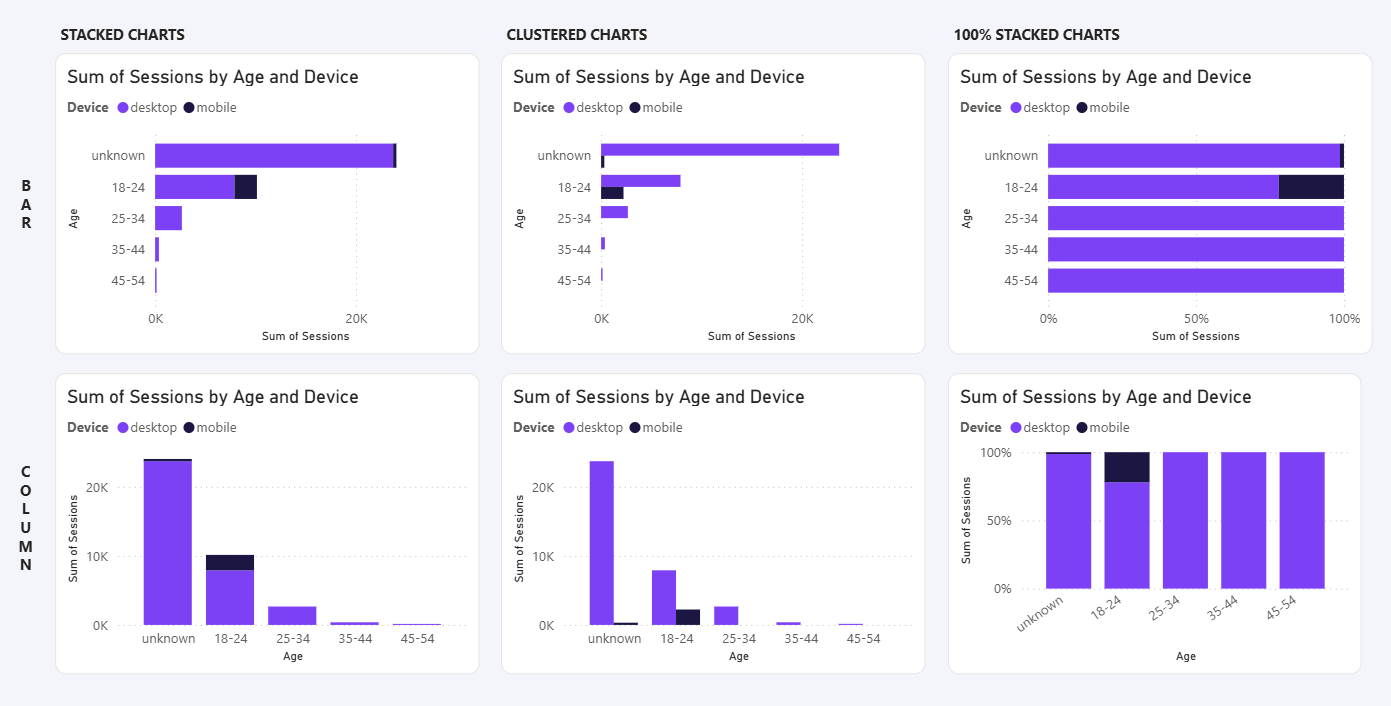
Bar and column charts in Power BI are excellent for comparing values across multiple categories. They provide a simple and familiar way to highlight differences, while remaining flexible and easy to read.

  • Pros: Easy to understand, interactive, and effective for quickly comparing multiple categories.
  • Cons: Can become cluttered with too many categories, suffer from label readability issues, and are not ideal for showing changes over time.

You can find 6 bar and column charts (3 of each) in Power BI:

  • Stacked bar chart
  • Stacked column chart
  • Clustered bar chart
  • Clustered column chart
  • 100% stacked bar chart
  • 100% stacked column chart

💡 Whether you use a bar chart or a column chart, the main difference is readability. For example, if you’re sorting data by age, a column chart works well because the values are easy to display. But if you sort by conversion name, a bar chart is often better since it makes the labels clearer. In the end, it’s all about choosing the format that keeps your data easy to read.

Line chart

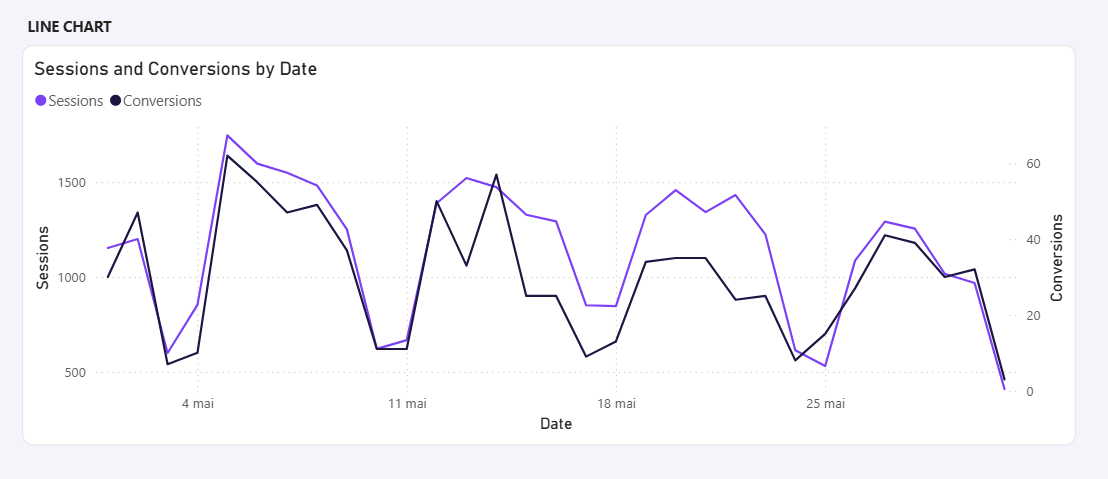
Line charts are essential when you want to track an evolution or identify a trend over time. They provide a clear way to visualize how values increase, decrease, or fluctuate, making them perfect for highlighting progress or spotting long-term patterns.

  • Pros: Ideal for showing data over time, easy to interpret trends, and effective for highlighting growth or decline.
  • Cons: Can become difficult to read with too many lines, may oversimplify complex data, and not well suited for comparing categories at a single point in time.

Combo charts

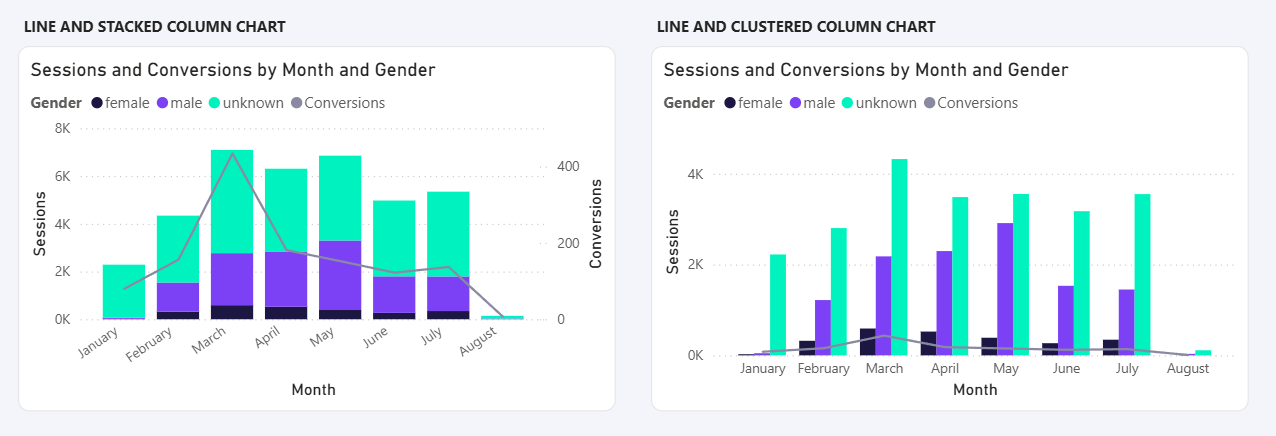
Combo charts combine two chart types (a column chart with a line chart) to show different measures on the same axis. They are particularly useful when you want to compare actual values against a trend, or display two related KPIs with different scales. In marketing, for example, you might use a combo chart to show ad spend as columns and conversions as a line.

  • Pros: Allows comparison of two types of data in one view, highlights relationships between metrics, and saves space in dashboards.
  • Cons: Can be harder to read if overused, may confuse the audience if the measures are not clearly related, and less effective if too many series are added.

Power BI offers 2 types of combo charts:

  • Line and Stacked Column Chart: Best for showing proportions.
  • Line and Clustered Column Chart: Ideal for making comparisons.

Area charts

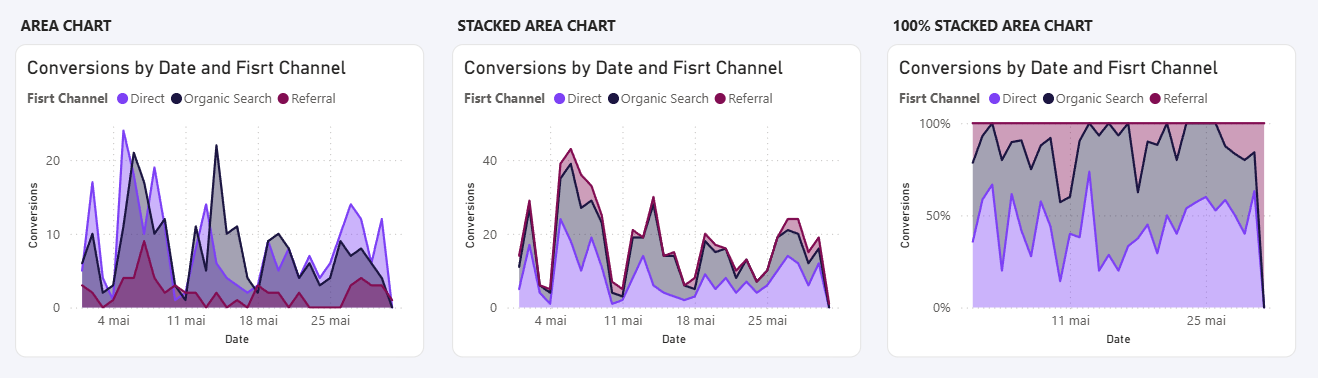
Area charts are similar to line charts but go further by highlighting cumulative values and showing how categories contribute to a total over time.

  • Pros: Great for showing overall trends and totals, useful to illustrate how each category contributes to the whole.
  • Cons: Can get cluttered with too many categories, harder to read than line charts, and may exaggerate differences.

Power BI provides 3 types of area charts:

  • Area chart: Similar to a line chart, but with the emphasis on volume.
  • Stacked area chart: Best for showing proportions over time. Keep in mind that it represents a cumulative total, not individual sums.
  • 100% stacked area chart: Ideal for visualizing proportions without needing exact numerical values.

Pie chart

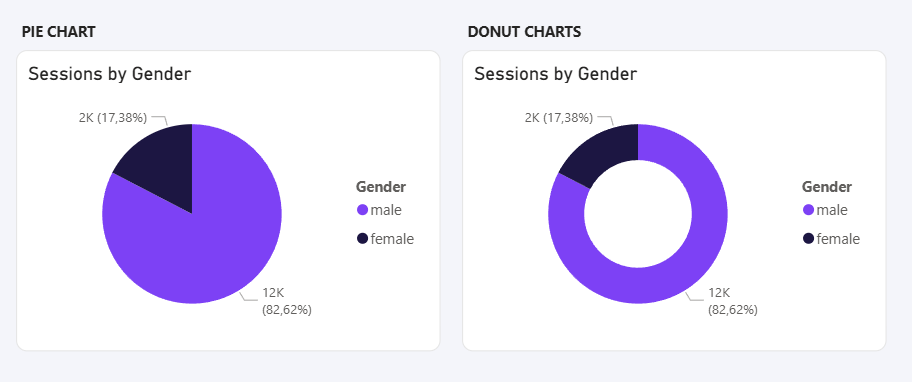
Pie charts (and donut charts) are ideal for showing proportions and illustrating how each category contributes to a whole.

  • Pros: Simple to understand, great for showing part-to-whole relationships, and visually appealing for small datasets.
  • Cons: Hard to read with too many categories, not precise for detailed comparisons, and less effective than bar charts when accuracy is needed.

Card & KPIs chart

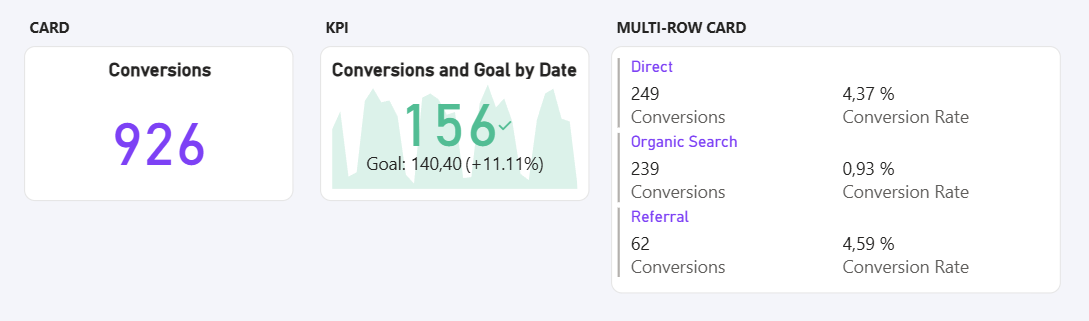
Card and KPI charts are the simplest visuals, displaying data as a single number. They make it easy to see the total of a metric (cost, revenue, etc.) and quickly compare it to a previous period or a defined target.

  • Pros: Very clear and straightforward, perfect for highlighting key metrics, and useful for quick comparisons against goals or past results.
  • Cons: Limited context, only shows one value at a time, and doesn’t provide details or breakdowns.

💡 In this category, Power BI offers three different charts: Card, KPI, and Multi-row Card. Choosing the right one depends on a key question: what level of detail do I want to display.

Waterfall chart

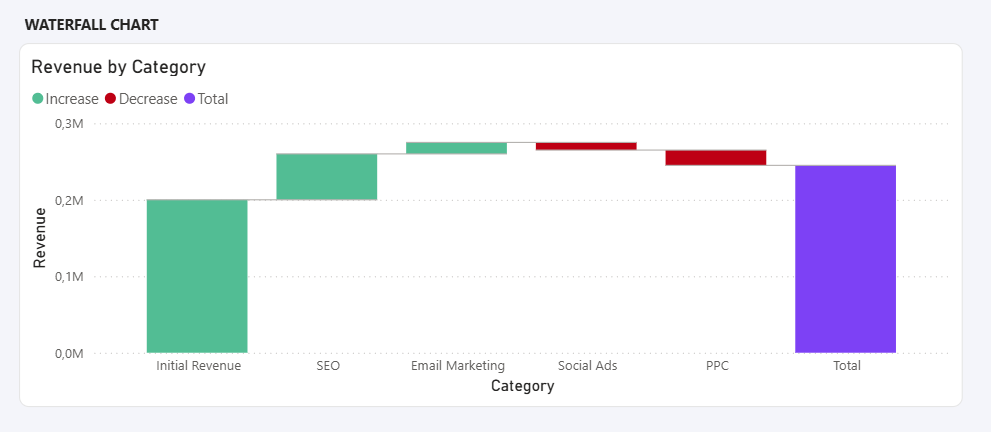
Waterfall charts are designed to show how an initial value is affected by a series of positive and negative changes, making it clear how you reach a final result. They are often used in finance and business analysis, but also work well in marketing, for example, to show how different actions or campaigns contribute to overall performance.

  • Pros: Great for visualizing step-by-step contributions, highlights increases and decreases clearly, and helps explain how results are achieved.
  • Cons: Can become confusing with too many steps, less effective for comparing categories, and not ideal for showing long-term trends.

Funnel chart

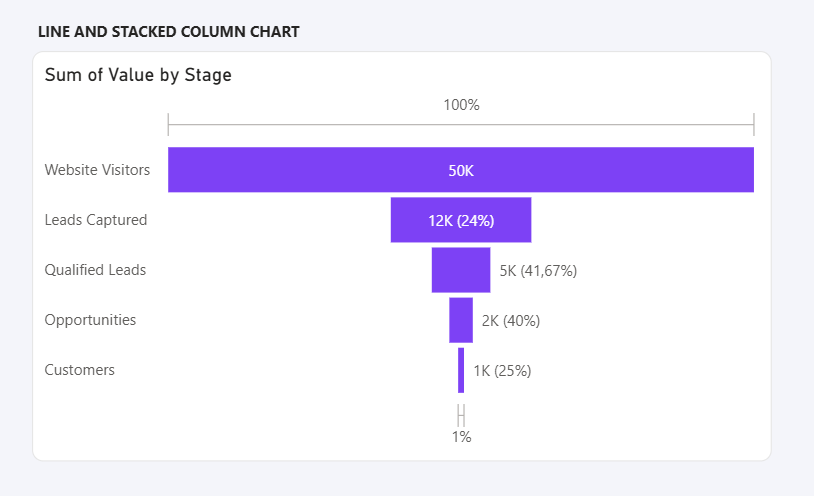
Funnel charts are used to represent data that flows through different stages, making it easy to see how values decrease step by step. They are especially relevant for processes with drop-offs, such as sales pipelines or customer journeys in marketing.

  • Pros: Clear way to show conversions across stages, highlights where the biggest drop-offs occur, and very intuitive for business and marketing processes.
  • Cons: Limited to sequential data, doesn’t explain why drop-offs happen, and can oversimplify complex processes.

Scatter chart

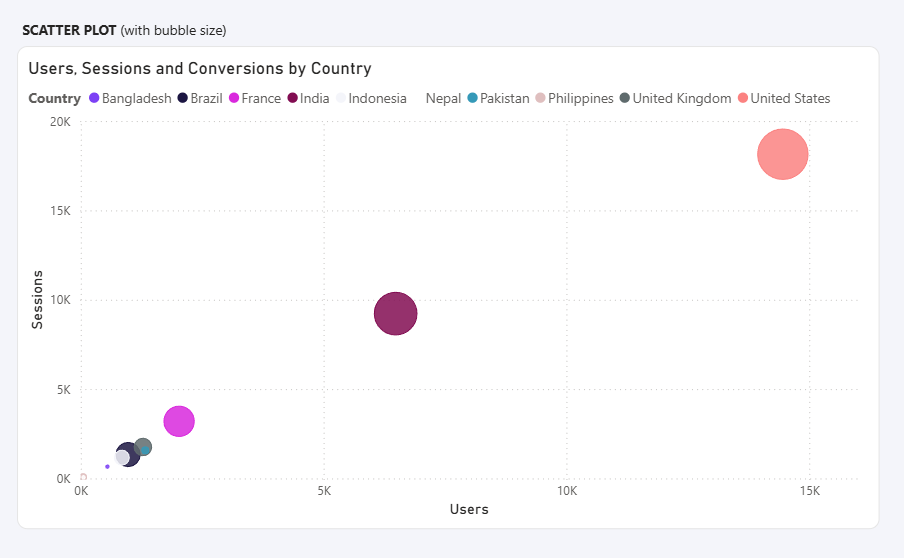
Scatter charts are used to show the relationship between two variables, making it easier to identify patterns, correlations, or outliers. In marketing, they can help compare metrics such as cost versus revenue, or impressions versus conversions. When you add a third variable to size the points, the scatter chart becomes a bubble chart, which allows you to add even more context to your analysis.

  • Pros: Great for spotting correlations, highlighting clusters or outliers, and adding depth when extended into bubble charts.
  • Cons: Can be hard to read with large datasets, requires interpretation skills, and may not be the best choice for quick comparisons.

Treemap

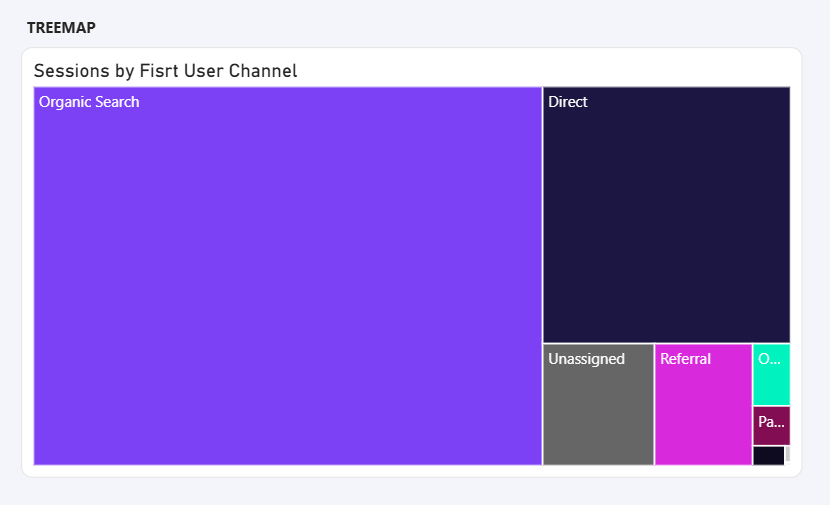
Treemaps display hierarchical data using nested rectangles, where the size of each block represents its value. They are useful for showing how different categories contribute to a whole, while also allowing a quick comparison between them. In marketing, for instance, they can be used to visualize budget allocation or the performance of different channels.

  • Pros: Great for showing part-to-whole relationships, works well with large datasets, and highlights the relative importance of categories at a glance.
  • Cons: Can be hard to read with too many small categories, doesn’t show trends over time, and lacks precision compared to bar or column charts.

Map

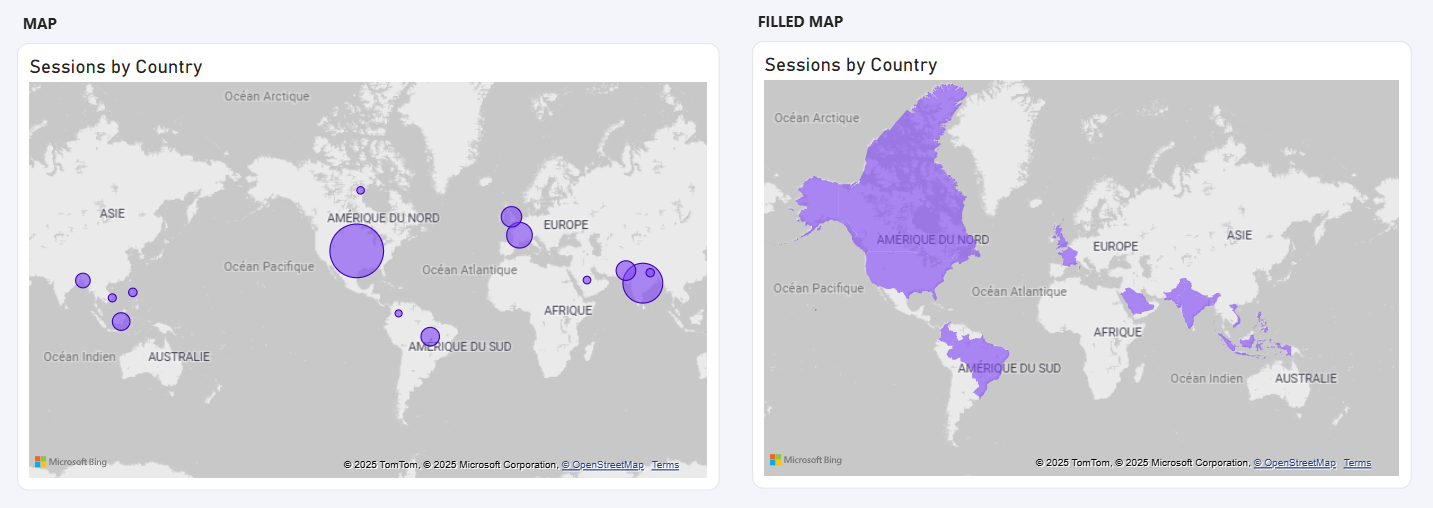
Map charts are designed to display data across geographical locations, making it easy to understand regional differences and distributions. In marketing, they are particularly useful to analyze performance by country, region, or city, such as sales, leads, or campaign reach.

  • Pros: Visually engaging, perfect for geographic insights, and helps spot regional trends at a glance.
  • Cons: Requires accurate location data, can become cluttered with too many points, and may oversimplify details without context.

Table & Matrices

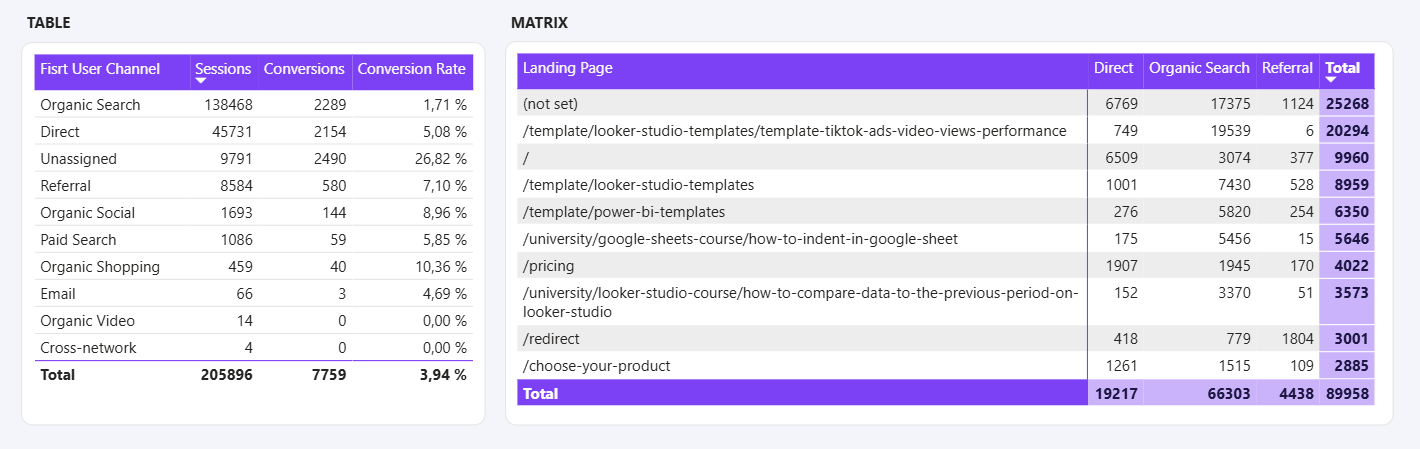
Tables and matrices in Power BI are the most straightforward visuals for displaying detailed, structured data. A table shows rows and columns with exact values, while a matrix extends this by allowing grouping, drilling, and cross-tab style analysis. In marketing, they are often used to list campaign results, leads, or performance metrics in detail.

  • Pros: Precise and detailed, great for showing raw data, supports hierarchies in matrices, and allows users to drill down for deeper insights.
  • Cons: Less visual and engaging than charts, harder to spot patterns at a glance, and can become overwhelming with too much data.

Best Power BI charts & visualizations

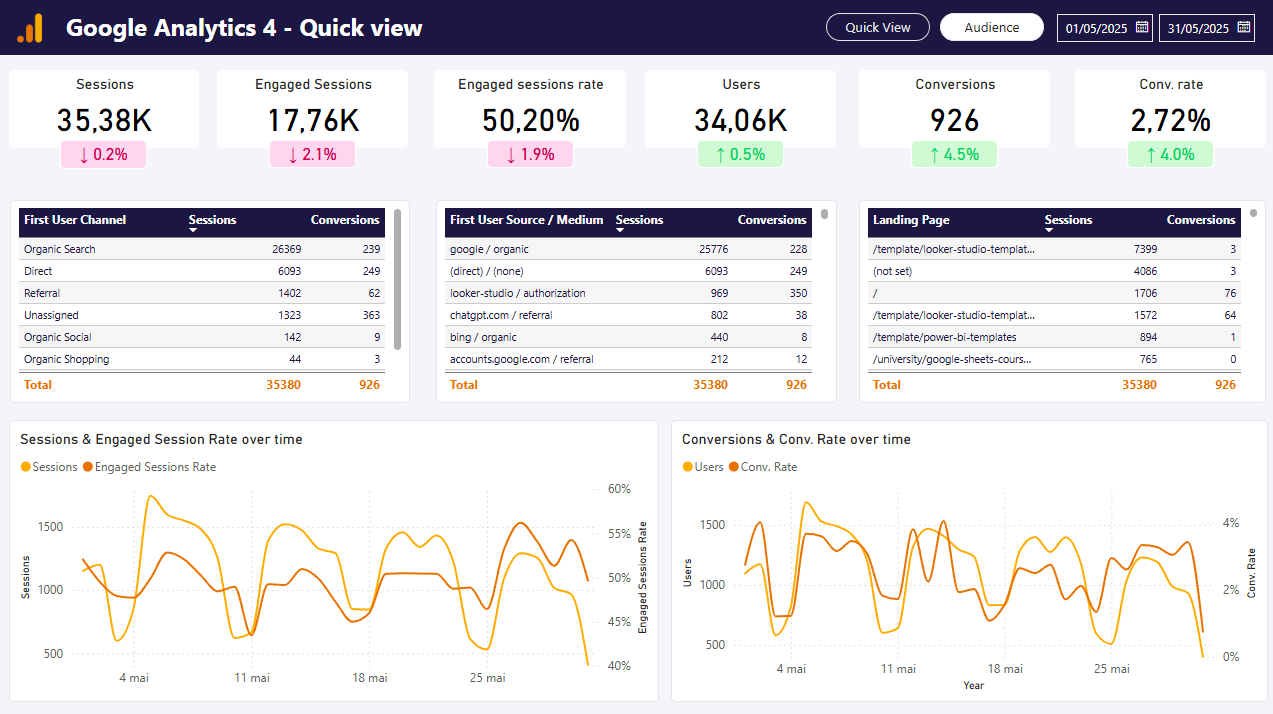
The choice of a chart always depends on the data you want to highlight and this rule works for all the reporting platform and also for marketing data vizualisation. Selecting between charts within the same category comes down to the level of clarity they provide. In fact, we can consider a dashboard successful when all its data is clear, valuable, readable, and easy to understand. The key insights should be grasped at a glance. The same principle applies to the choice of colors and the layout of visuals on a page. You can also draw inspiration from Power BI dashboard examples and templates.

Free Power BI dashboard template for GA4

Visualize your Marketing data in Power BI

Understanding the strengths and limitations of each Power BI chart is the first step to creating dashboards that truly make your data meaningful. Once you know which visuals to use, the real value comes from connecting the right data. With Catchr integration, you can easily bring all your marketing data (Google Ads, Facebook Ads, LinkedIn, and more) directly into Power BI. This way, you can apply the charts we’ve just reviewed to track campaigns, analyze performance, and uncover insights that drive smarter decisions.

No items found.

In this template, you will find all the metrics and dimensions you would need to get a better view of your data.

If you need more templates, you could look at our looker studio template gallery.

No items found.

In this template, you will find all the metrics and dimensions you would need to get a better view of your data thank to our integrations.

If you need more templates, you could look at our PowerBI template gallery.

Looker studio

Start analyzing your data with a Looker Studio template

Catchr provides free dashboard templates to help you start analyzing your data on Looker Studio — 100+ available templates!

See all the Looker Studio templates

Start analyzing your data with a Looker Studio template

Catchr provides free dashboard templates to help you start analyzing your data on Looker Studio — 100+ available templates!

See all the Looker Studio templates

Start analyzing your data with a Power BI template

Catchr provides free dashboard templates to help you start analyzing your data on Power BI — 20+ available templates!

See all the Power BI templates

Start analyzing your data with a Power BI template

Catchr provides free dashboard templates to help you start analyzing your data on Power BI — 20+ available templates!

See all the Power BI templates
Google Sheets

Start analyzing your data with a Google Sheets template

Catchr provides free dashboard templates to help you start analyzing your data on Google Sheets — 20+ available templates!

See all the Google Sheets templates

Start analyzing your data with a Google Sheets template

Catchr provides free dashboard templates to help you start analyzing your data on Google Sheets — 20+ available templates!

See all the Google Sheets templates

Connect all your Marketing data to Power BI

Simplify your data extraction with 75+ marketing data connectors to easily move your data to Power BI. No-code integration!

Start your free trial

✔ 14 days free trial — No credit-card required

Easily connect your to Power BI

Move your data from to Power BI with Catchr's no-code integration. Easy to set up, always up-to-date. Automate your data extract now!

Connect your data to multiple destinations

Easily integrate your data thanks to Catchr's no-code connector. Move your data to dashboard tools, spreadsheets, database and more... 20+ destiantions available

Start your free trial

✔ 14 days free trial — No credit-card required

Move your Marketing data to your favorite tools

Simplify your data extraction and move all your Marketing data to dashboard tools, spreadsheets, database and more... No code required!
75+ connectors | 20+ destinations

Start your free trial

✔ 14 days free trial — No credit-card required

Unlock Insights with Style!

Transform your marketing data into stunning dashboards.

Integrate, visualize, and impress with Catchr's seamless dashboards. Elevate your data game now!
Build your first report
14 days free-trial - No credit card required 🎉

More blog post about

No items found.