Blog post
Catchr
Looker Studio
Pipedrive
Looker Studio is a powerful, free tool for visualizing and analyzing your sales and marketing data. If you use Pipedrive, you can connect it directly to Looker Studio to track deals, activities, revenue, and team performance in real time.
There are two main ways to do it:
In this guide, we’ll walk you through both methods step by step.
Connecting Pipedrive to Looker Studio gives you a unified view of your sales performance, deals, and revenue trends.
Instead of jumping between Pipedrive dashboards and spreadsheets, you can centralize everything in a single, automated report.
With Looker Studio, you can:
In short, connecting Pipedrive to Looker Studio helps you make smarter, data-driven decisions and track performance efficiently.
This is the most powerful and scalable way to connect Pipedrive to Looker Studio.
It lets you automate updates, manage multiple pipelines, and customize metrics and dimensions effortlessly.
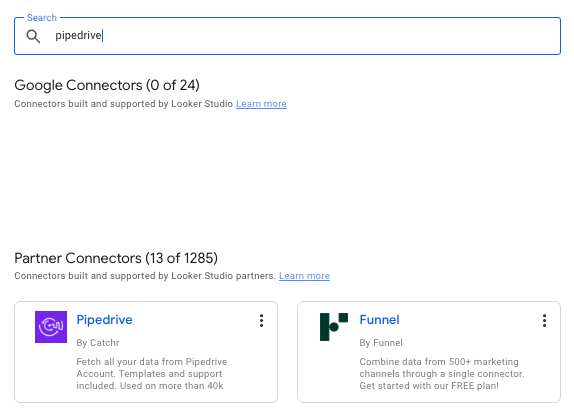
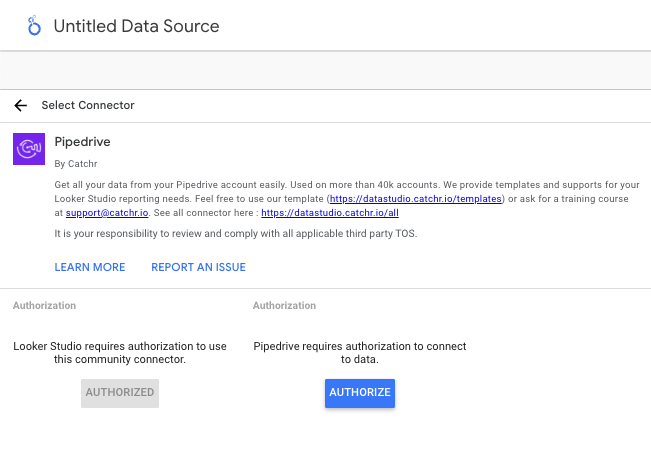
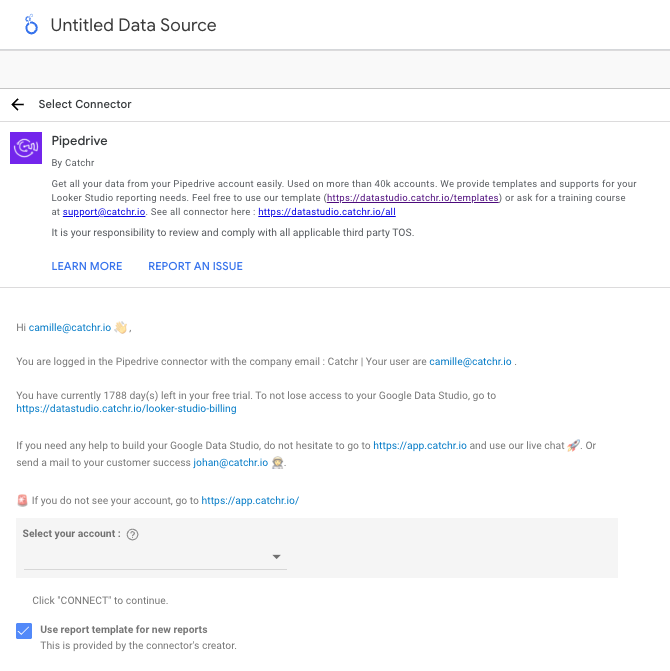
The Catchr Pipedrive connector links directly to the Pipedrive API and automatically pulls your deals, organizations, activities, and users into Looker Studio. Your dashboards refresh daily, ensuring your sales data is always up to date, no CSV exports required.

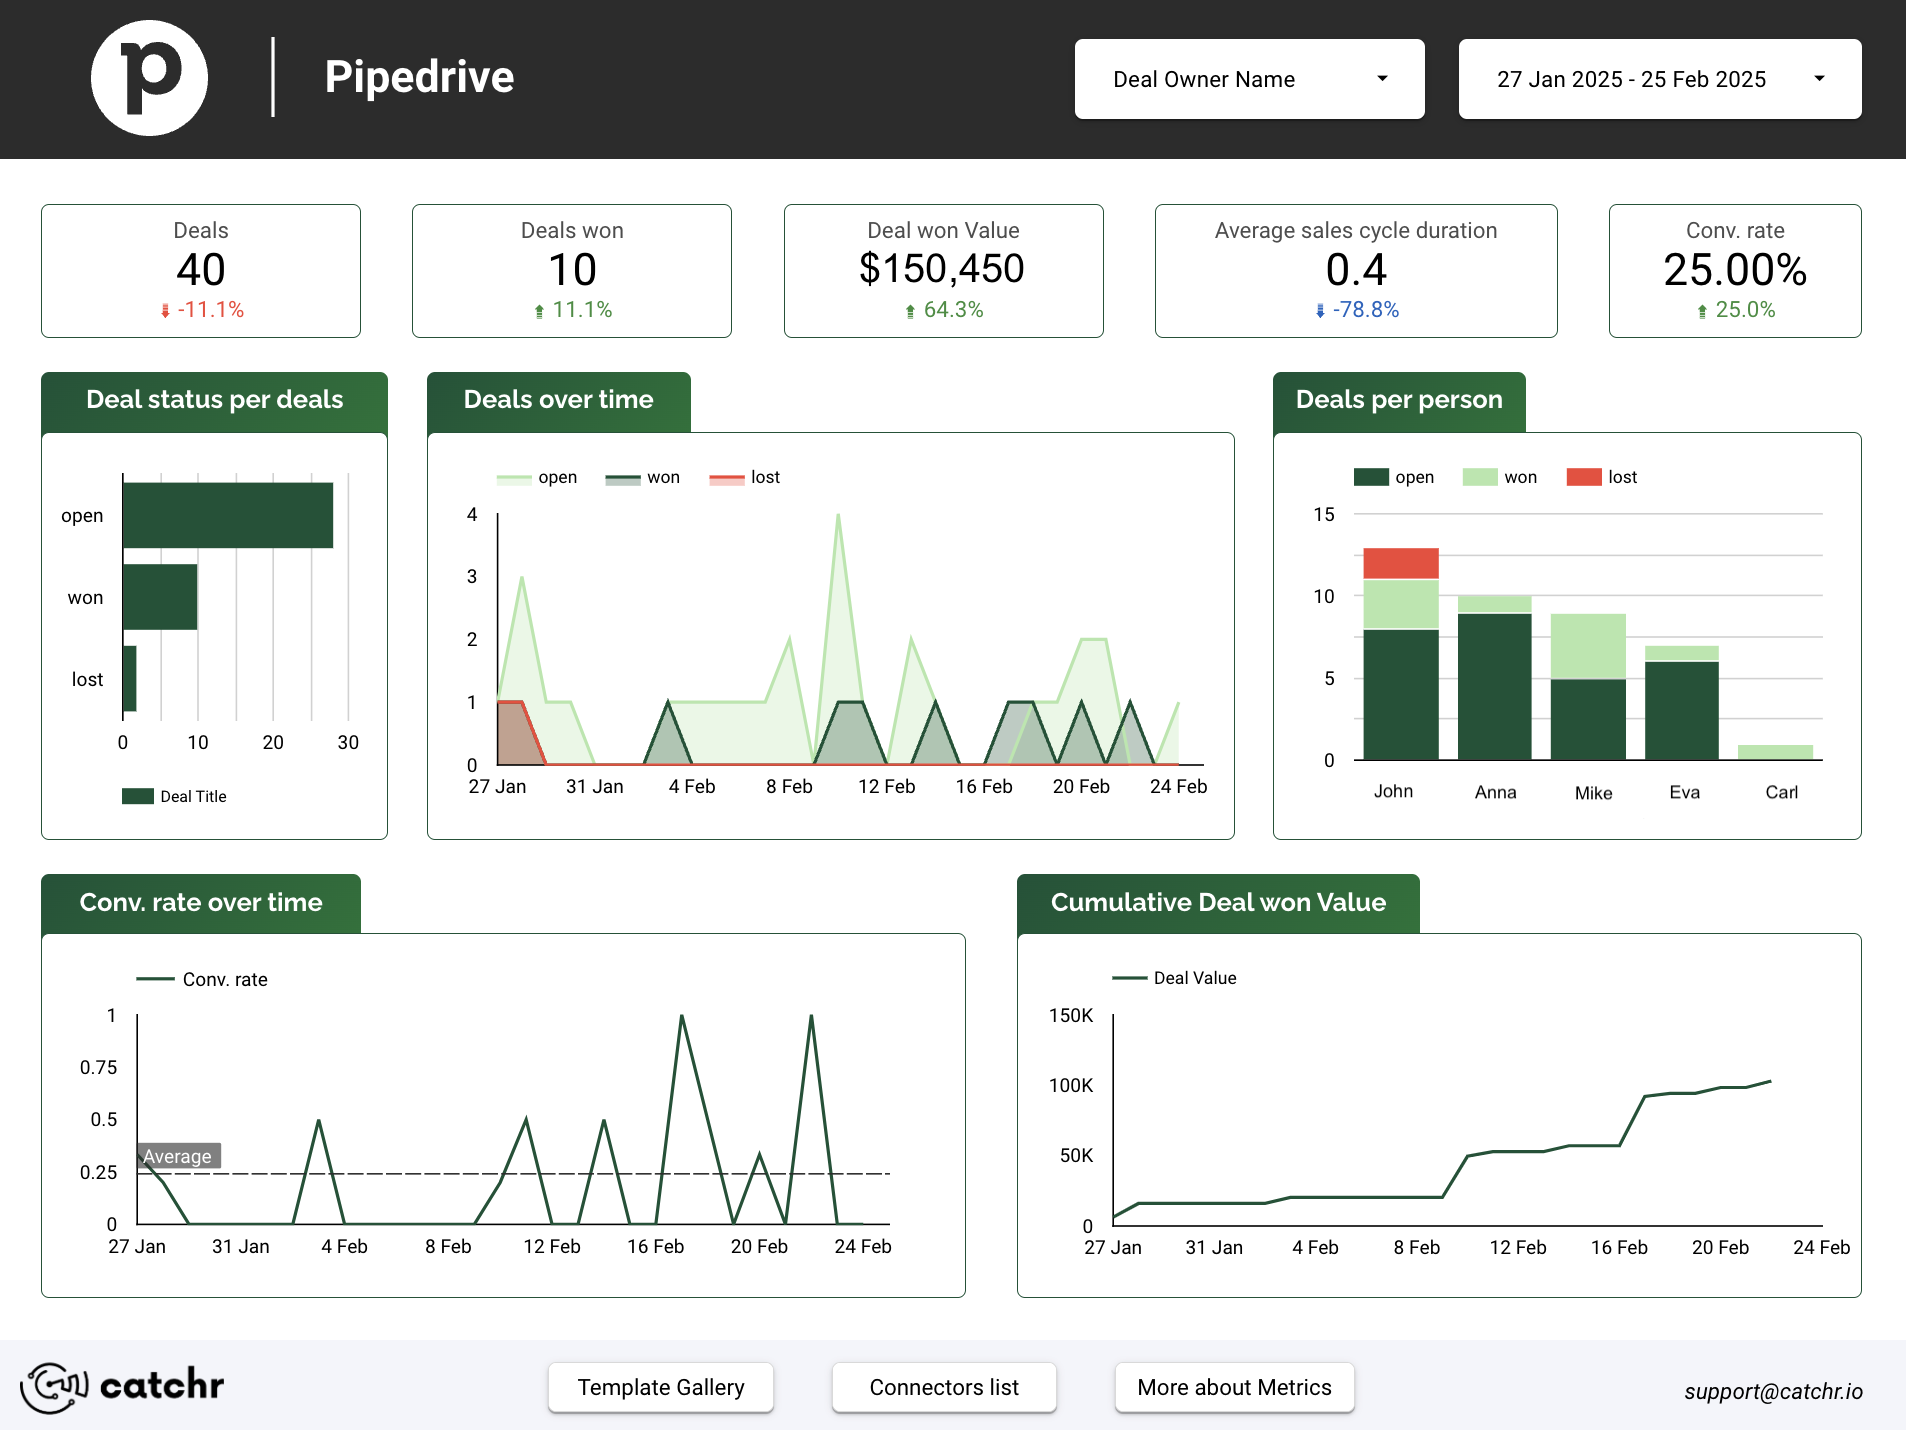
Connecting Pipedrive to Looker Studio lets you analyze your pipeline, track team activity, and automate sales reporting.
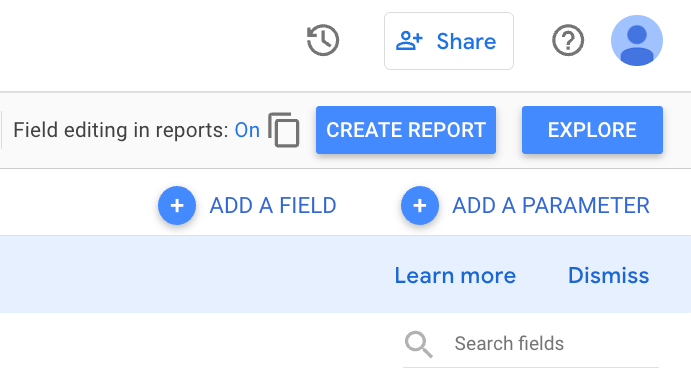
To help you get started faster, Catchr provides a ready-to-use template for Pipedrive in Looker Studio.
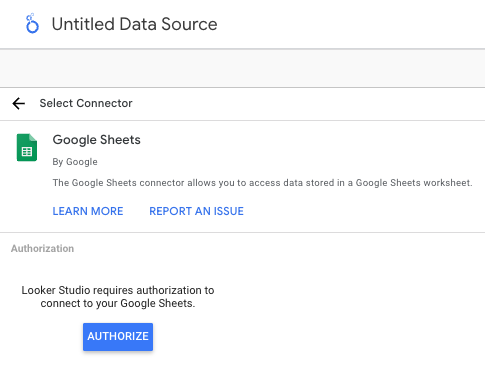
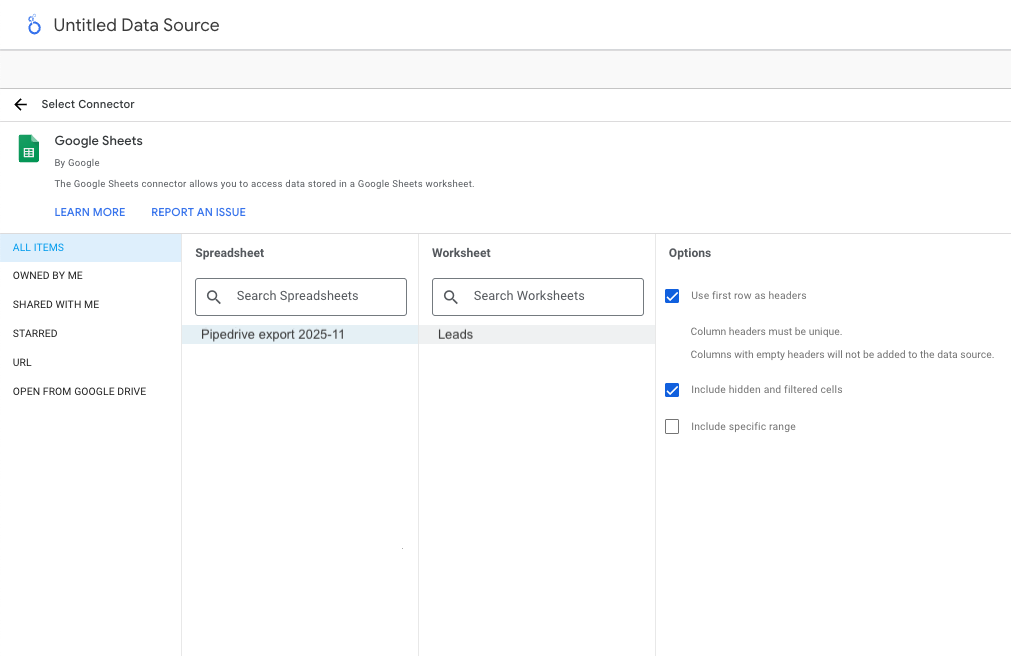
If you prefer a free, manual method, you can use Google Sheets as an intermediary.
However, this option requires manual exports or automation tools like Zapier to keep your data updated.
You’ll export your Pipedrive data as a CSV and import it into Google Sheets, then connect the spreadsheet to Looker Studio using the Google Sheets connector.

If you manage multiple pipelines or need real-time dashboards, the Catchr connector is the best choice. For small projects or one-off reports, Google Sheets can do the job.
Yes. Catchr supports multiple Pipedrive organizations in one Looker Studio report.
Yes. Catchr refreshes your Pipedrive data daily.
Absolutely. You can blend Pipedrive data with Google Ads, HubSpot, or CRM data for full funnel analysis.
You can pull deals, revenue, organizations, users, and activities data, including stages, owners, and expected close dates. All the available Pipedrive fields are listed on Catchr's documentation.
Catchr offers a free trial, then a paid plan for continuous synchronization and automation.
Whether you use the manual method or the Catchr Pipedrive connector, Looker Studio lets you visualize your sales pipeline, automate reporting, and track team performance in one place.
Start using Looker Studio with a ready-to-use template
Get the template
Start analyzing your data with a Looker Studio template
Catchr provides free dashboard templates to help you start analyzing your data on Looker Studio — 100+ available templates!
See all the Looker Studio templatesStart analyzing your data with a Power BI template
Catchr provides free dashboard templates to help you start analyzing your data on Power BI — 20+ available templates!
See all the Power BI templatesStart analyzing your data with a Power BI template
Catchr provides free dashboard templates to help you start analyzing your data on Power BI — 20+ available templates!
See all the Power BI templatesStart analyzing your data with a Google Sheets template
Catchr provides free dashboard templates to help you start analyzing your data on Google Sheets — 20+ available templates!
See all the Google Sheets templatesStart analyzing your data with a Google Sheets template
Catchr provides free dashboard templates to help you start analyzing your data on Google Sheets — 20+ available templates!
See all the Google Sheets templates✔ 14 days free trial — No credit-card required
✔ 14 days free trial — No credit-card required
Move your Marketing data to your favorite tools
Simplify your data extraction and move all your Marketing data to dashboard tools, spreadsheets, database and more... No code required!
75+ connectors | 20+ destinations
✔ 14 days free trial — No credit-card required


