Blog post
Catchr
Looker Studio
Facebook Ads

Looker Studio is a powerful free tool for creating dashboards and visualizing your marketing data. However, it offers limited native connectors, which means Facebook Ads data isn’t directly available.
If you’re reading this, you probably want to import your Facebook Ads campaigns into Looker Studio to analyze performance, track KPIs, and automate your reporting.
The good news? It’s absolutely possible. In this guide, you’ll learn two ways to connect Facebook Ads to Looker Studio:
To make things even easier, you can follow our video tutorial below to automate your Facebook Ads data connection to Looker Studio.
Connecting your Facebook Ads data to Looker Studio gives you a complete view of your marketing performance in one place. Instead of jumping between Meta Ads Manager and other analytics tools, you can centralize and visualize all your key metrics, impressions, clicks, spend, conversions, and ROAS, inside an interactive dashboard.
With Looker Studio, you can:
In short, connecting Facebook Ads to Looker Studio transforms raw ad data into actionable insights, helping you make faster, data-driven decisions and optimize your ad spend.
For most marketers and analysts, the automated connection is the more efficient and scalable solution. It uses the Facebook Ads API to sync your data directly into Looker Studio.
Partner connectors such as Catchr connect Facebook Ads and Looker Studio. Once authorized, the connector uses the official Facebook Marketing API to pull your campaign data into Looker Studio.
Your metrics and dimensions are then refreshed automatically at regular intervals, ensuring that your dashboard always reflects the latest performance results, no manual exports or uploads required.
Connecting your Facebook Ads data to Looker Studio helps you turn campaign results into clear, actionable insights. Whether you manage ads for your own business or multiple clients, this connection makes performance tracking and reporting much easier.
Freelancers centralize multiple clients’ ad accounts in one dashboard to monitor performance in real time.
Agencies build automated, white-labeled dashboards using connectors like Catchr to share accurate, always up-to-date reports with clients.
Marketing teams automate their weekly performance reports, focusing on key metrics such as spend, clicks, conversions, and ROAS, without the need for manual exports.
To help you get started faster, Catchr offers ready-to-use Looker Studio templates for Facebook Ads, such as:
These templates are fully customizable and automatically refresh with your latest data, allowing you to focus on analyzing performance and optimizing your strategy instead of building reports from scratch.
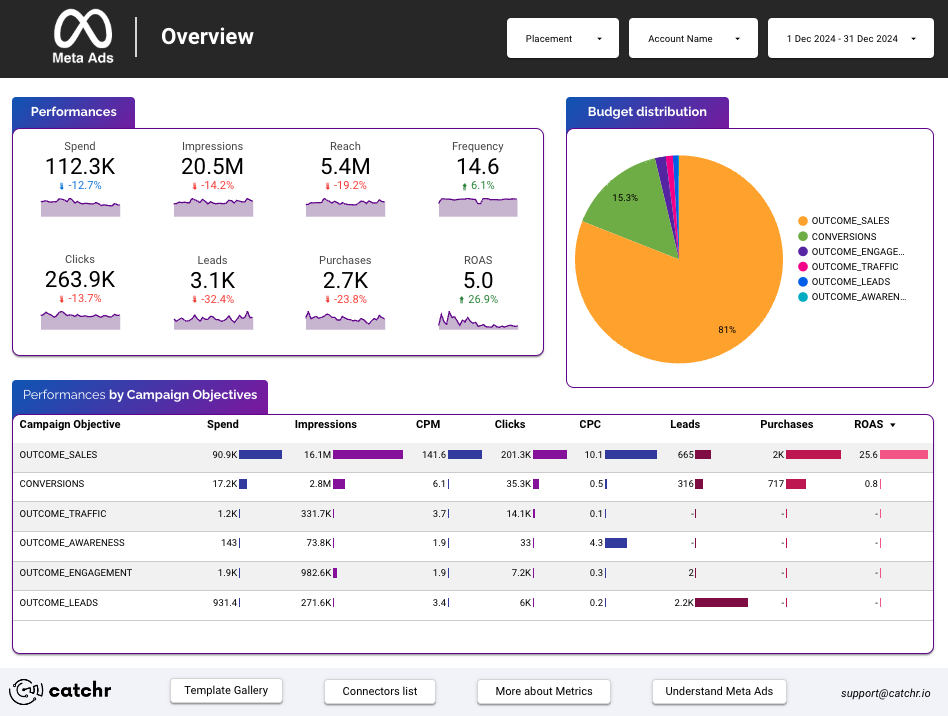
A Looker Studio dashboard providing a full overview of your Facebook Ads performance KPIs, get the Facebook Ads report template.

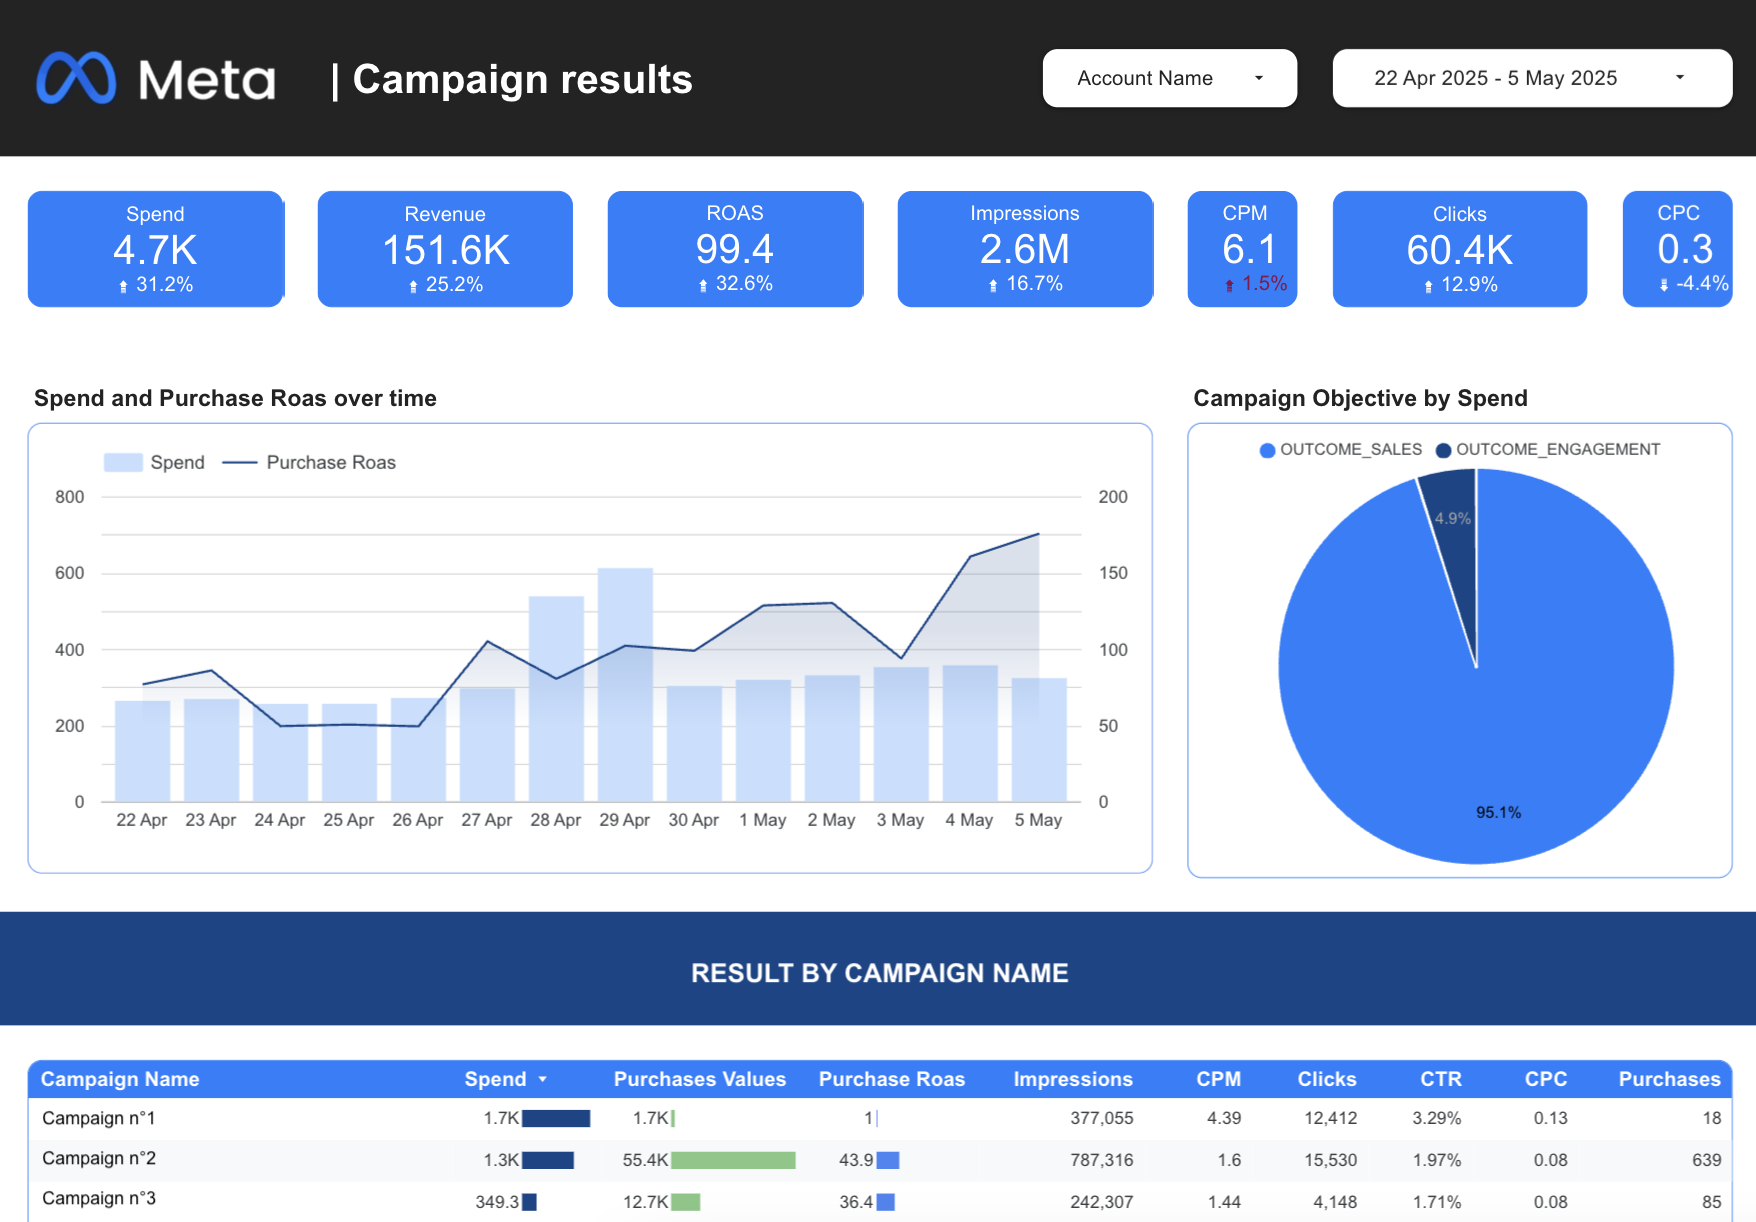
A Looker Studio dashboard to analyze Facebook Ads performance by campaign objective, get the Facebook Ads campaign performance template.

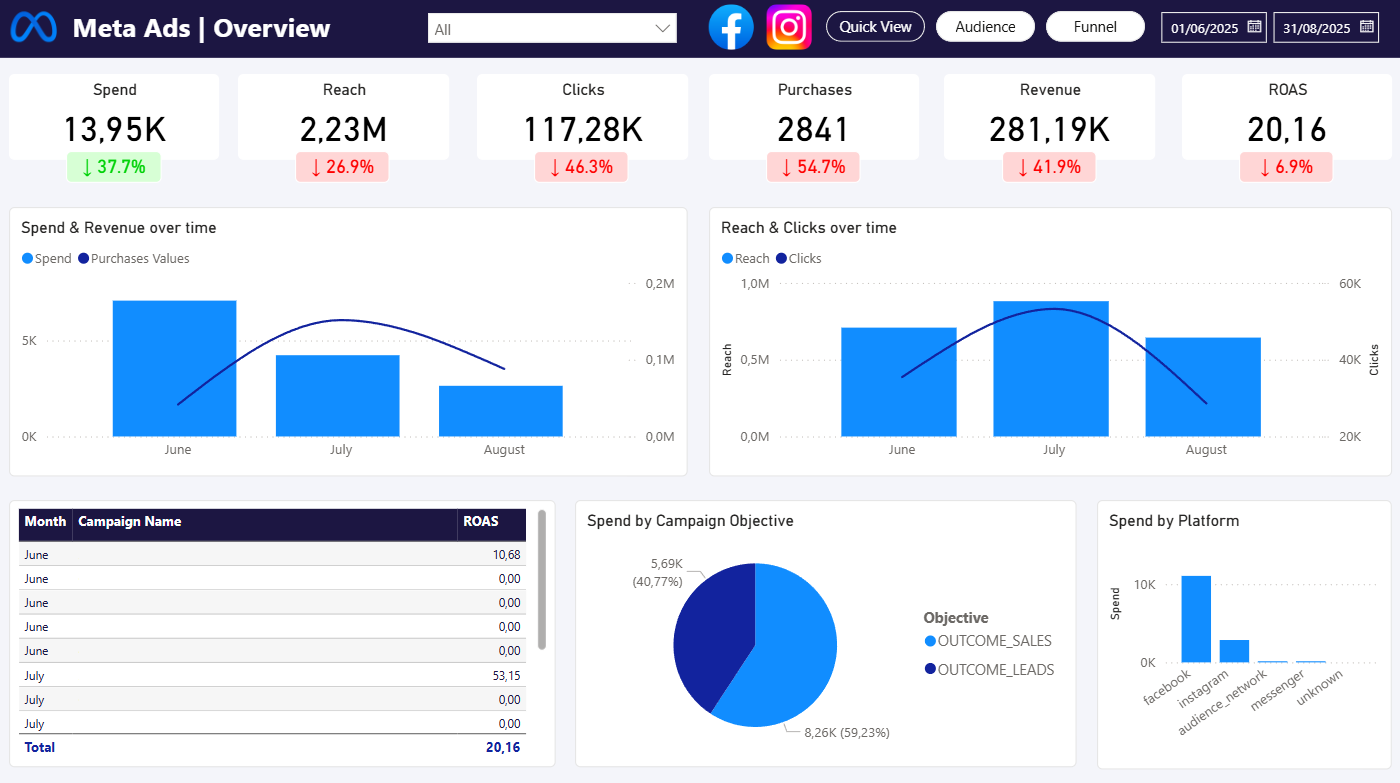
Finally, if you want to track your Facebook Ads insights wherever you are, get the Facebook Ads responsive template.

If you only need to analyze a small dataset or don’t want to use an external tool, the manual CSV method is a simple option. It requires no third-party services, but it’s not automated.
If you manage several accounts or need up-to-date data, the connector option is the clear winner. For small projects or one-time reports, the CSV method works just fine.
Yes. Connectors like Catchr support multiple ad accounts within a single report.
Yes. Catchr connectors refresh data daily or on demand.
Absolutely. You can blend data from Facebook, Google Ads, TikTok, LinkedIn, or your CRM to build a full marketing overview. Find the integration you need.
You can access all key campaign metrics, including impressions, clicks, spend, conversions, CTR, ROAS, and more. With connectors like Catchr, you can also retrieve custom conversions, breakdowns (age, device, country), and attribution windows. Find the complete list of Facebook Ads available fields on Catchr's documentation.
Connecting your Facebook Ads data to Looker Studio helps you track performance more clearly, visualize key metrics, and make better decisions. Whether you use the manual CSV method or a partner connector like Catchr, you gain full control over your campaign reporting. Once your data is connected, you can focus on analyzing results and improving your advertising strategy instead of managing files.

Start using Looker Studio with a ready-to-use template
Get the template
Start analyzing your data with a Looker Studio template
Catchr provides free dashboard templates to help you start analyzing your data on Looker Studio — 100+ available templates!
See all the Looker Studio templates
Start using Power BI with a ready-to-use template
Get the template
Start analyzing your data with a Power BI template
Catchr provides free dashboard templates to help you start analyzing your data on Power BI — 20+ available templates!
See all the Power BI templates
Start using Google Sheets with a ready-to-use template
Get the template
Start analyzing your data with a Google Sheets template
Catchr provides free dashboard templates to help you start analyzing your data on Google Sheets — 20+ available templates!
See all the Google Sheets templates✔ 14 days free trial — No credit-card required


✔ 14 days free trial — No credit-card required

Move your Marketing data to your favorite tools
Simplify your data extraction and move all your Marketing data to dashboard tools, spreadsheets, database and more... No code required!
75+ connectors | 20+ destinations
✔ 14 days free trial — No credit-card required

