How to use the Zoom feature in Looker Studio
Learn how to use the Zoom feature in Looker Studio to explore charts in detail. Discover how to enable it, use it with time series and Google Maps, and apply it for marketing analysis.
The Zoom feature in Looker Studio allows users to explore a specific part of a chart in greater detail. It makes a visualization interactive by letting the user enlarge a particular area to closely examine a period, a trend, or a variation.
Zoom feature advantages in Looker Studio
With Zoom, users can:
- Analyze a specific detail of a time series without altering report filters.
- Detect anomalies or performance spikes over a shorter period.
- Compare local trends without losing the broader data view.
How to use Zoom in Looker Studio
Zoom with time series chart
To activate Zoom, simply:
- Select the chart you want
- In the right-hand panel, under the Setup tab, open the Chart interactions section
- Enable the Zoom option
To verify that it’s working, switch to View mode, then left-click and drag over a date range in the chart to zoom in.
To return to the original view, right-click and select Reset zoom, or click the reset button in the chart controls.
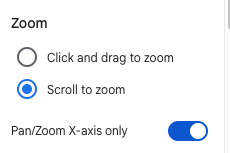
You can also enable zooming via mouse scroll:
In the Style tab, open the Zoom section and activate the Scroll to zoom option.
Zoom and Pan with Google maps
By default, Zoom and Pan features are enabled on Google maps, allowing users to freely explore and navigate the visualization.
You can zoom in to take a closer look at specific areas, or zoom out to get a broader overview of your data. The Pan function lets you smoothly move across the map without losing context.
If you prefer a fixed view, you can simply uncheck this option in the Style tab. This will disable user interactions, keeping the map static and ensuring that everyone sees the same predefined perspective.
Limitations
Zoom currently doesn’t come with panning (outside for Google maps components), which would allow users to move the zoomed-in window along the X-axis without changing the zoom level itself.
That’s unfortunate. Especially since scroll zoom, which is usually more practical, becomes less useful here because you can’t choose exactly which part of the chart to zoom in on.
Marketing use cases with Zoom in Looker Studio
- Zoom In on a specific campaign: On a chart showing daily conversions, users can zoom into a particular period, like Black Friday or a product launch, to observe day-to-day variations and identify top-performing days.
- Analyze a spike in ad spend: On an ad spend chart, Zoom helps take a closer look at the week when the budget increased to pinpoint which channel or campaign caused the change.
- Study local seasonality: By zooming into a few weeks of an organic traffic chart, you can spot recurring visit patterns, for example weekend dips and Monday peaks, and compare them with other time periods.
Conclusion
Zoom is a handy feature that makes exploring your data easier and more intuitive. While it could become even more powerful with a pan mode to move along the X-axis, it already offers a great way to focus on specific areas of your charts.

