Blog post
Catchr
Looker Studio
Google Analytics
Looker Studio is a powerful free tool for building interactive dashboards and visualizing your analytics data. If you want to analyze your Google Analytics 4 (GA4) data directly in Looker Studio, you can easily do so using Google’s built-in connector or a partner connector like Catchr. These options let you turn your web and app data into visual, shareable insights, without exporting files or writing SQL queries.
Before diving into the steps, you can also watch our short video tutorial below to see exactly how to connect your GA4 property to Looker Studio in just a few minutes.
Connecting GA4 to Looker Studio gives you a clear view of how users interact with your website or app. Instead of relying solely on the GA4 interface, you can create fully customized reports that highlight the metrics that matter most to you.
With Looker Studio, you can:
In short, integrating GA4 with Looker Studio helps you turn data into decisions faster and more effectively.
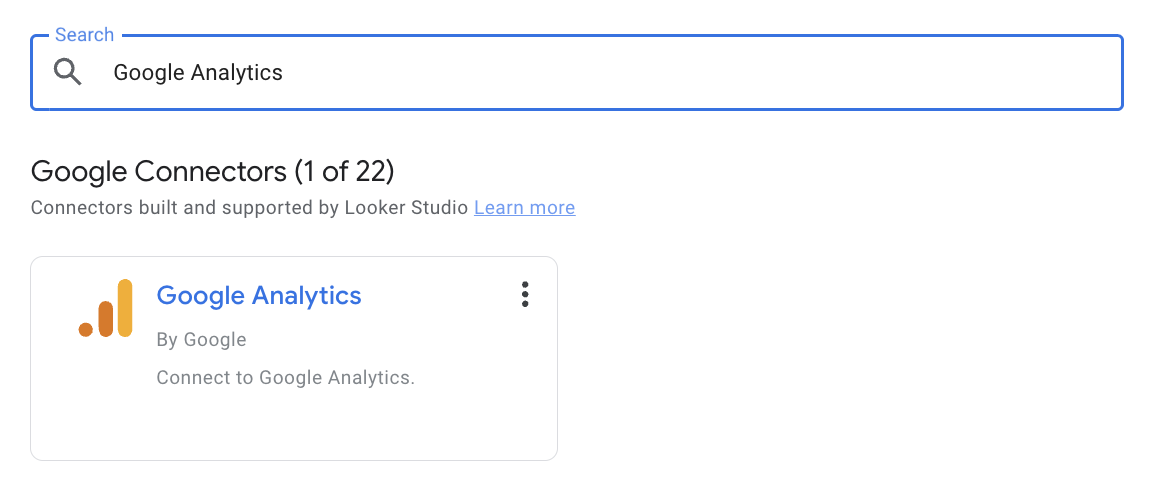
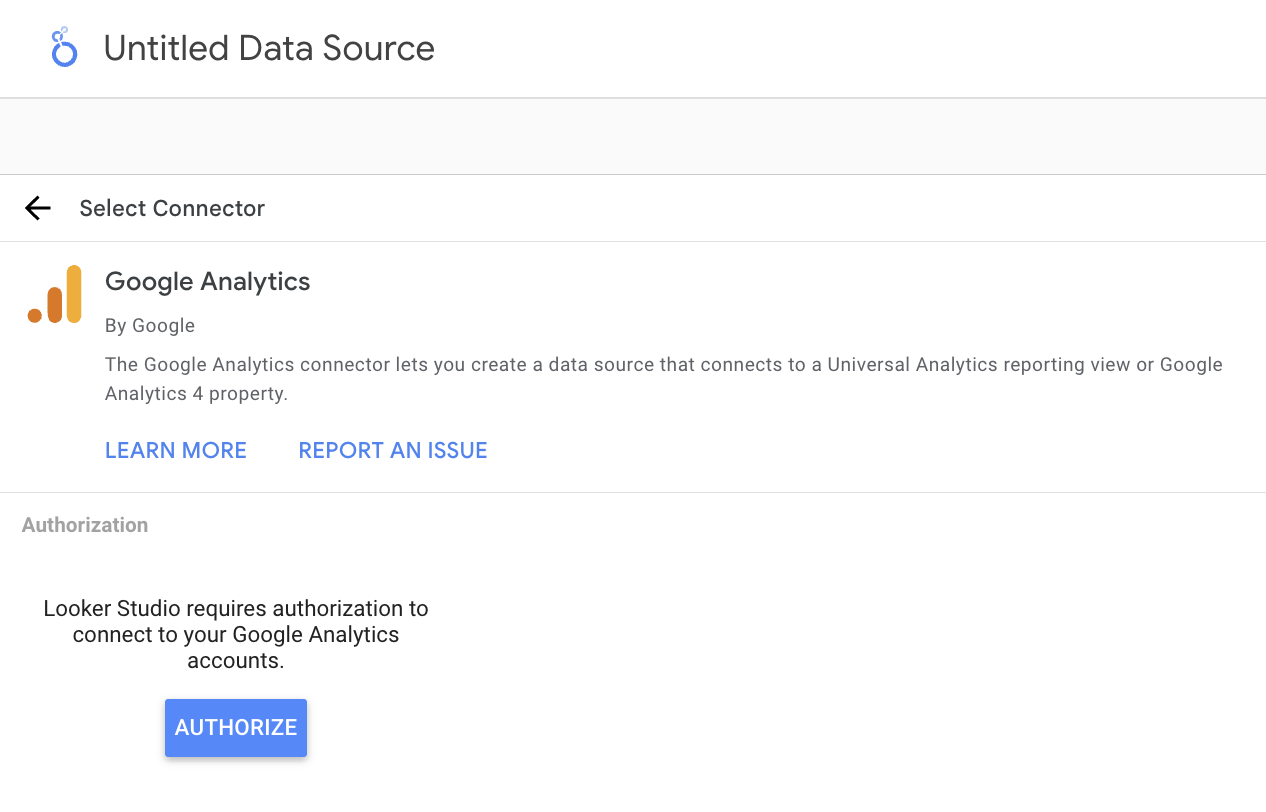
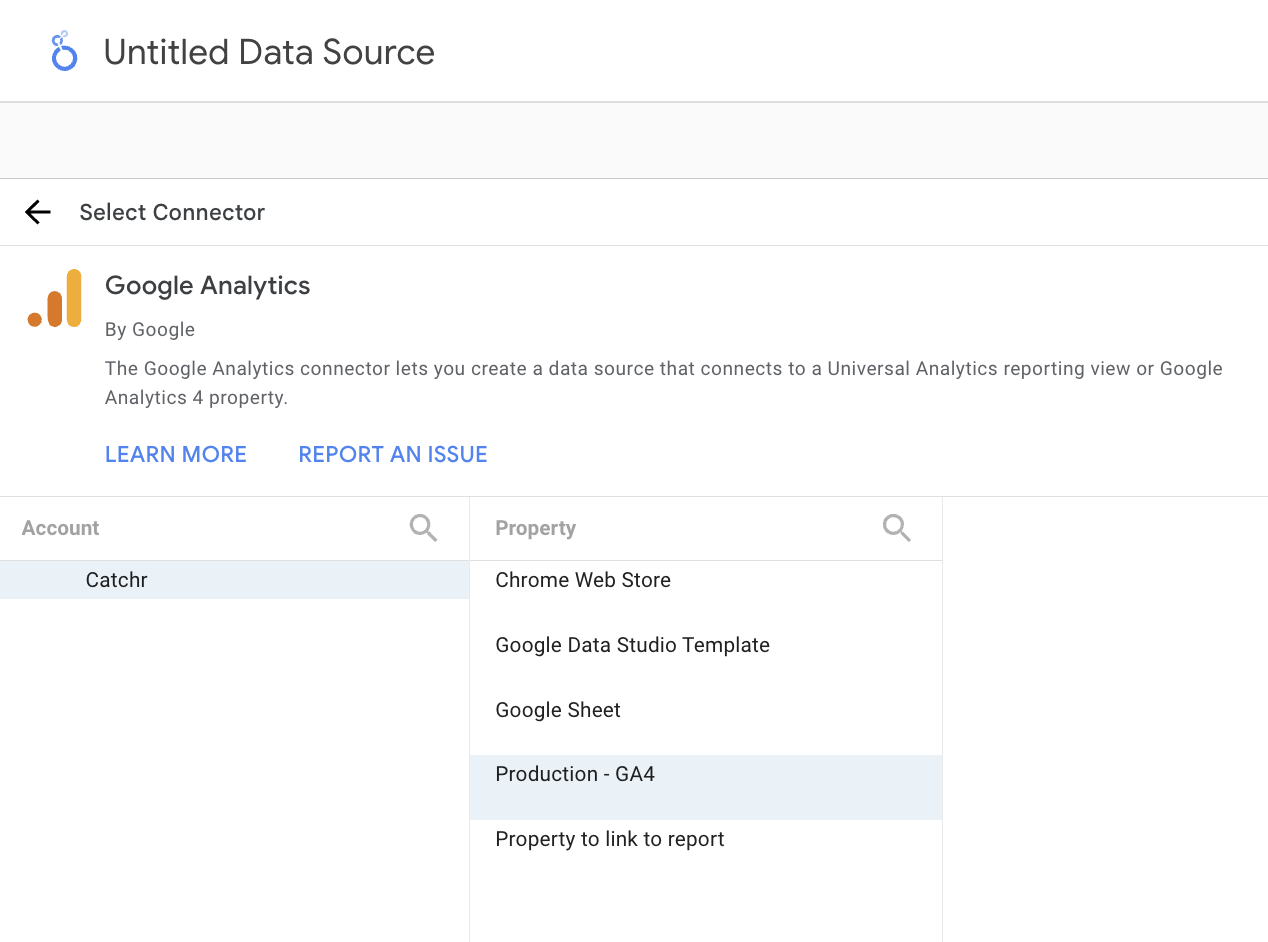
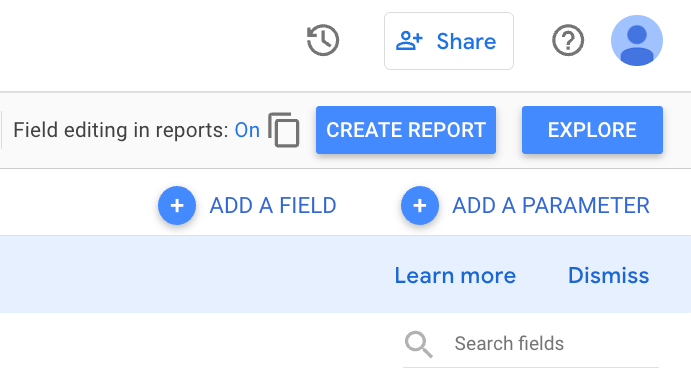
The native GA4 connector is the simplest and completely free way to connect your Google Analytics 4 property to Looker Studio.
This connector, provided directly by Google, retrieves your data in real time through the official GA4 API. You can explore metrics like users, sessions, engagement rate, bounce rate, and conversions, and even your custom events and custom dimensions if they’re defined in your GA4 property.
However, the native connector still has a few limitations:
💡 If you need to analyze multiple GA4 properties, blend data across different streams, or avoid sampling entirely, a GA4 third-party connector like Catchr can help unify and automate your reports.

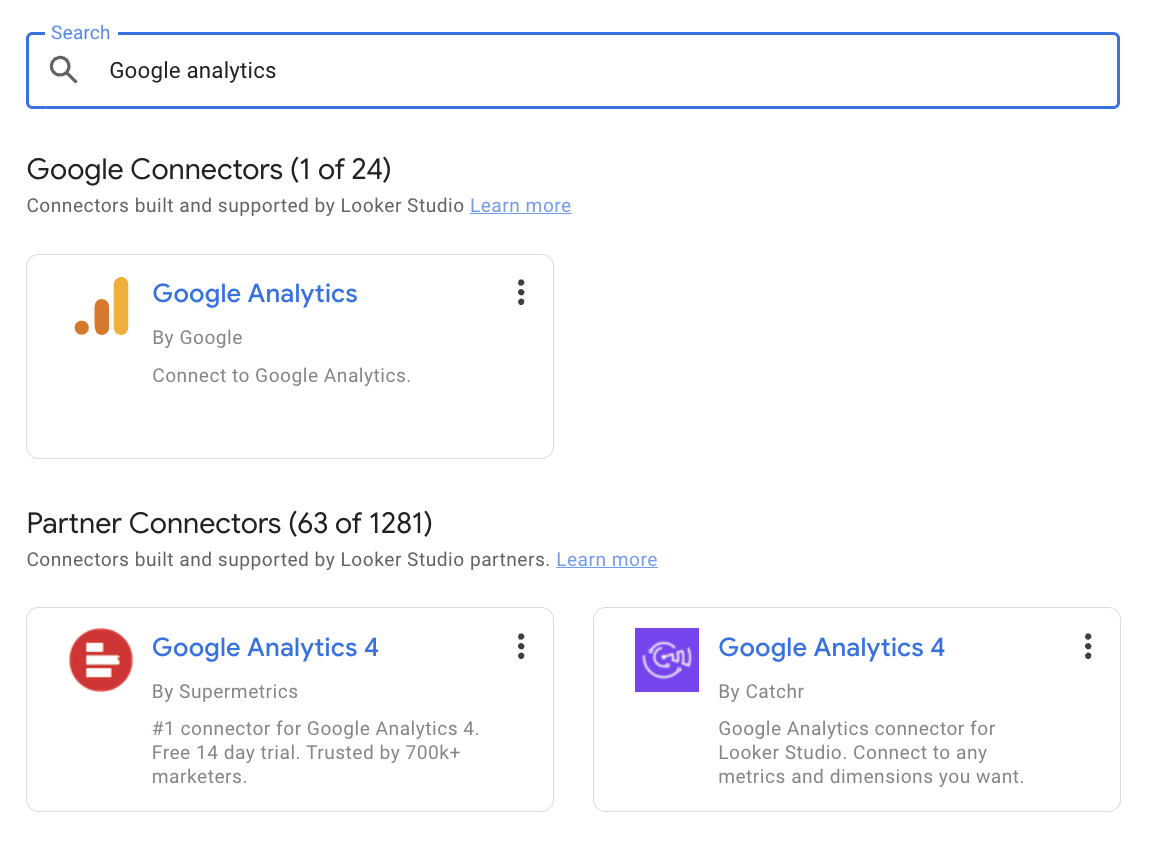
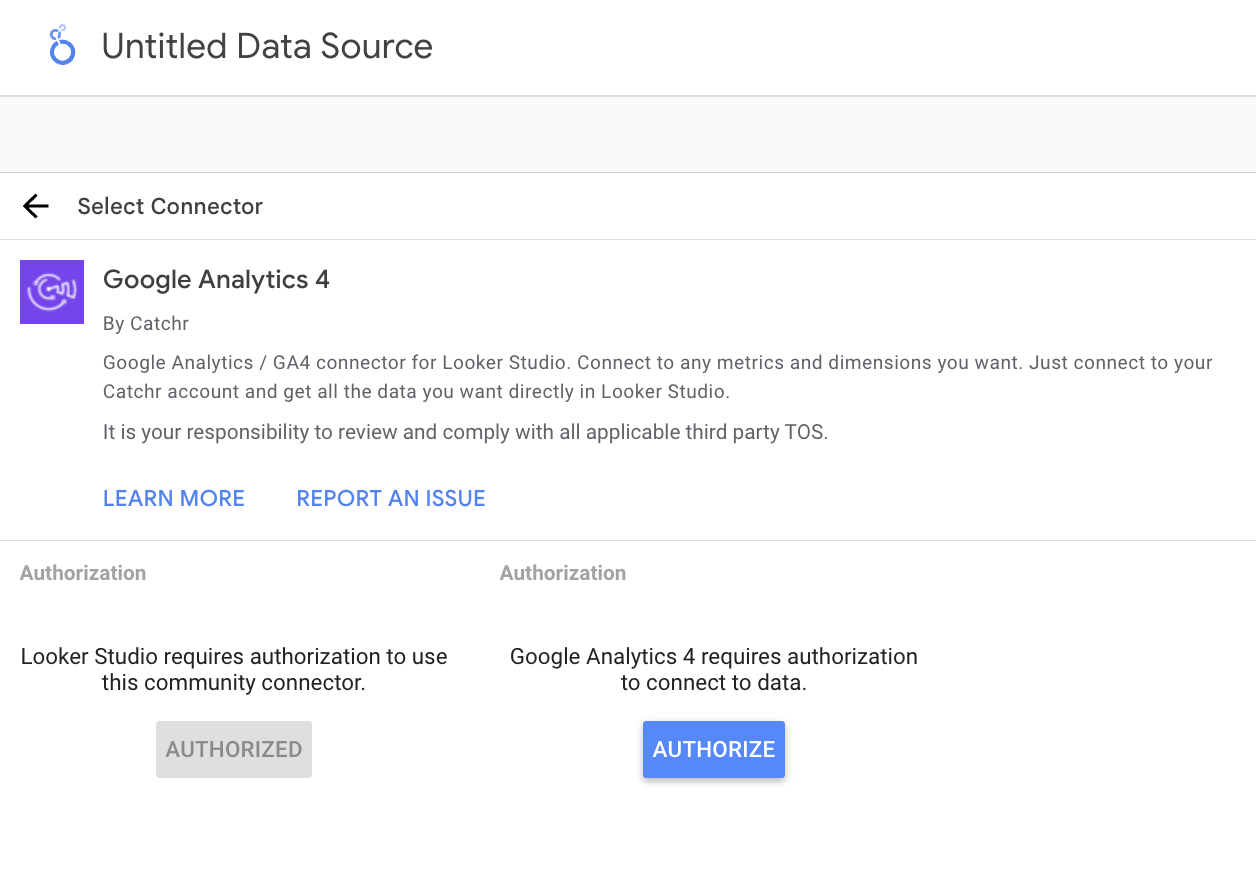
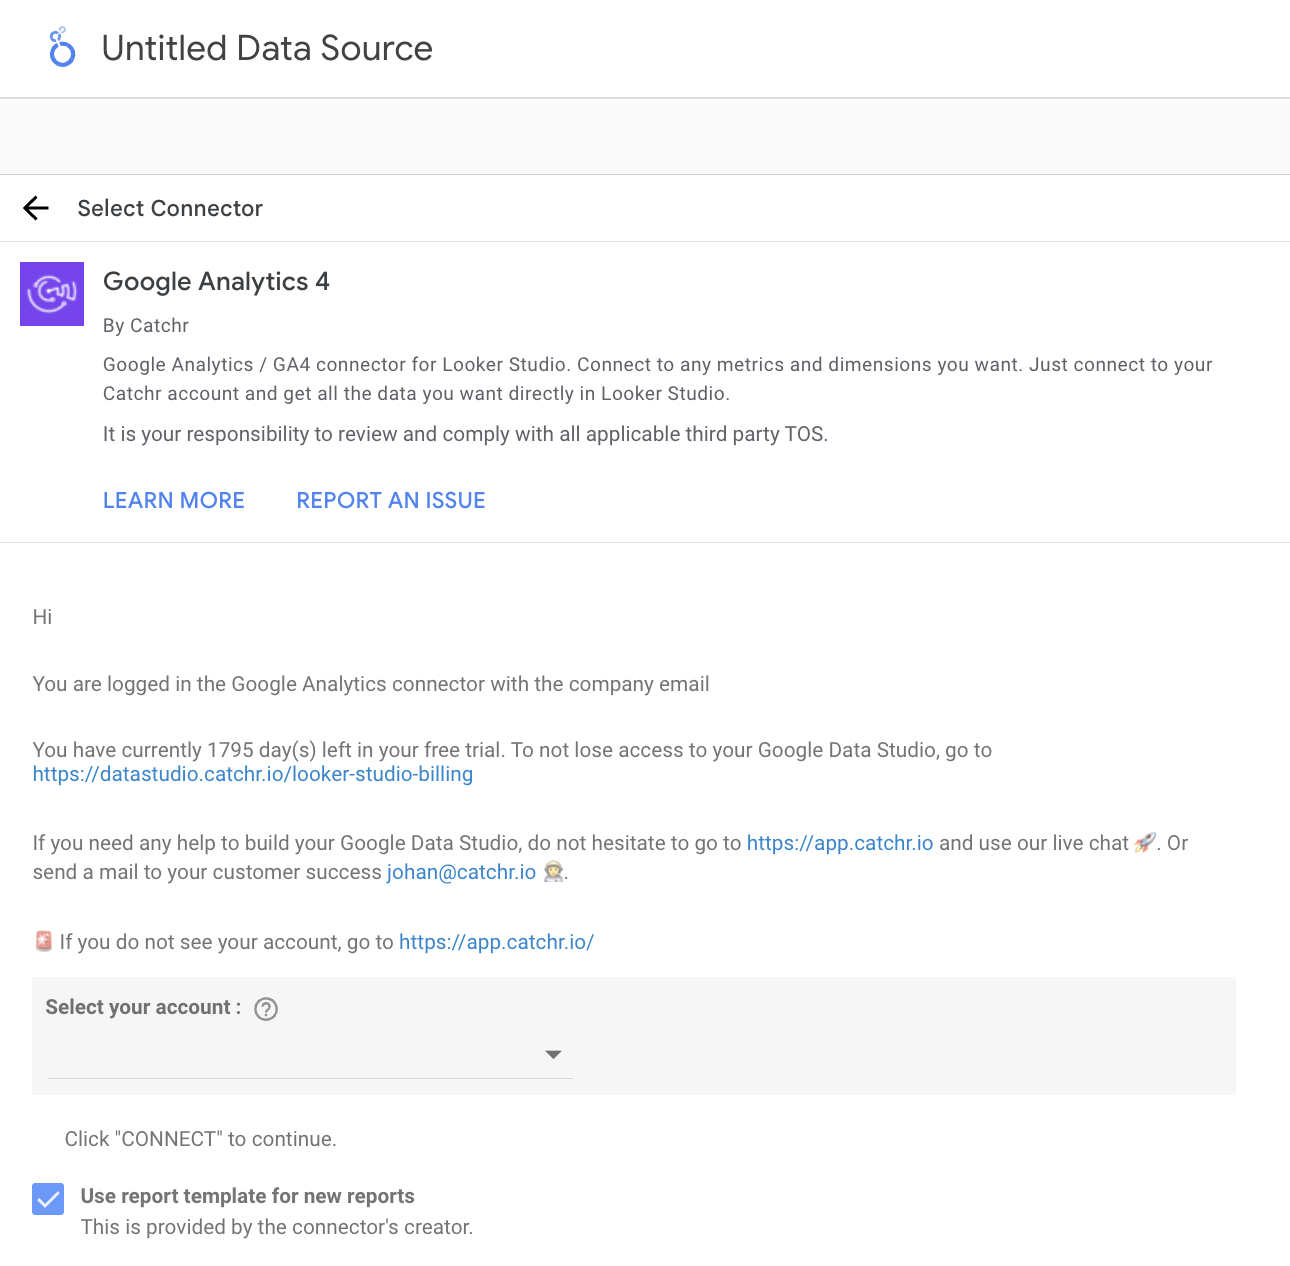
If you want to go beyond the limitations of the native connector, for example, managing multiple GA4 properties or combining data from web and app streams, Catchr is the ideal solution.
Catchr connects directly to the Google Analytics 4 API, allowing you to pull data from multiple properties and streams at once. It supports custom events, custom dimensions, UTM parameters, and eCommerce tracking, and lets you merge GA4 data with your other marketing sources such as Google Ads, Meta Ads, or LinkedIn Ads.
💡 Why use Catchr instead of the native connector?
Using Catchr helps you centralize all your analytics data in one scalable, automated dashboard.
Connecting GA4 to Looker Studio allows you to track user behavior, measure engagement, and monitor conversions more effectively. Here are a few practical examples:
Freelancers build client dashboards highlighting traffic sources, engagement, and conversions.
Agencies create white-labeled dashboards that merge GA4 with Google Ads or Meta Ads to show complete performance insights.
Marketing teams monitor acquisition channels, event tracking, and conversion funnels across devices and campaigns.
To help you get started faster, Catchr offers ready-to-use Looker Studio templates for GA4:
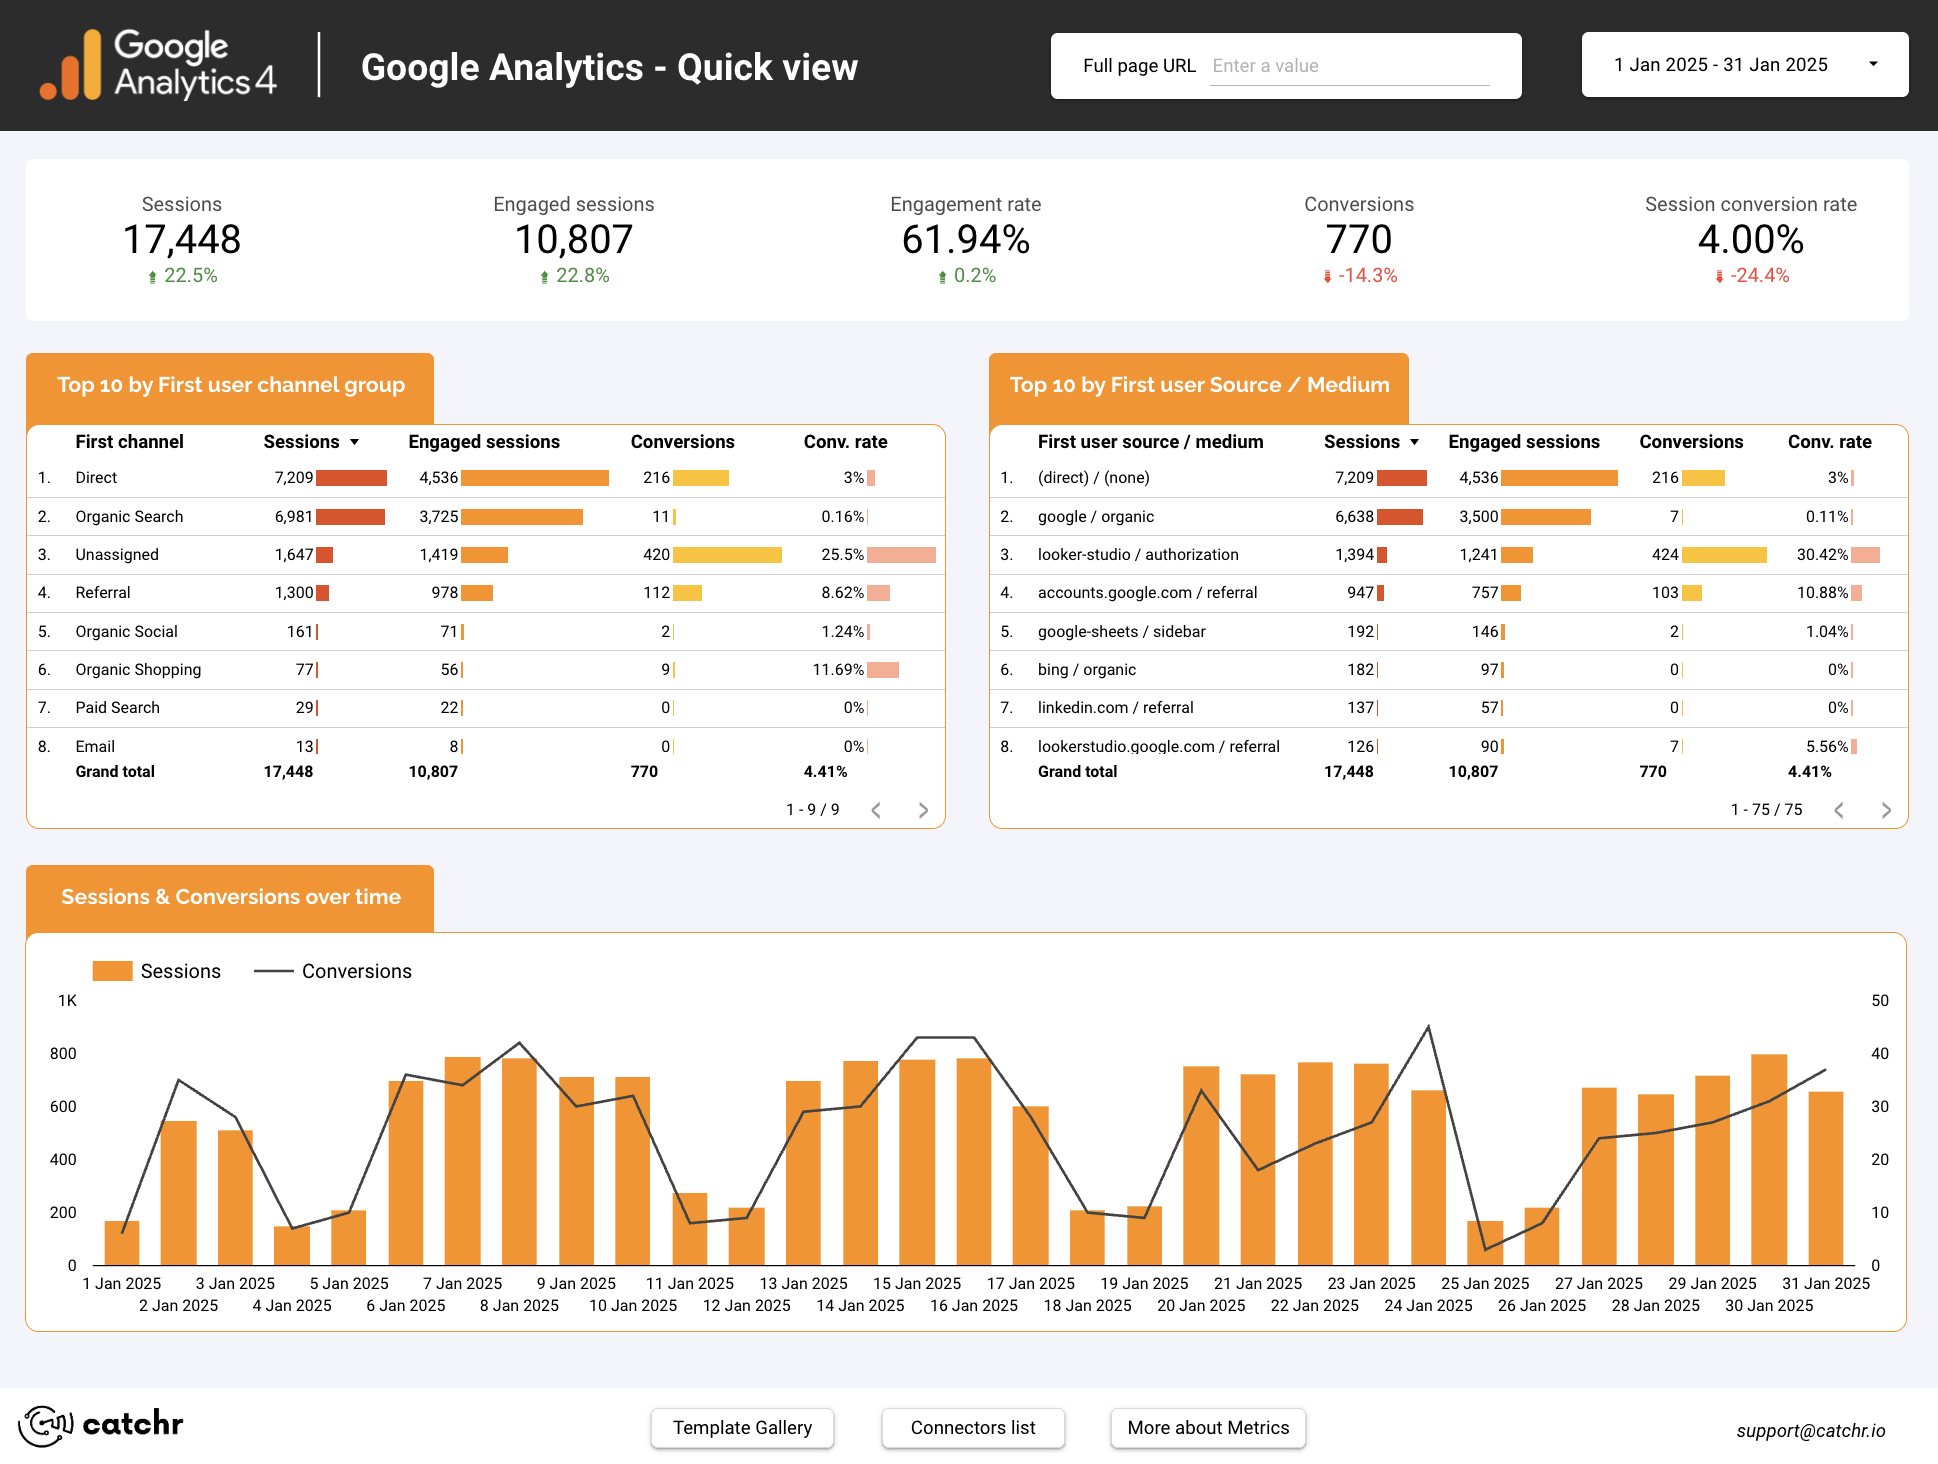
Analyze traffic and performance trends with the Google Analytics 4 main dashboard template, designed to visualize your sessions, engagement rate, and top traffic sources.
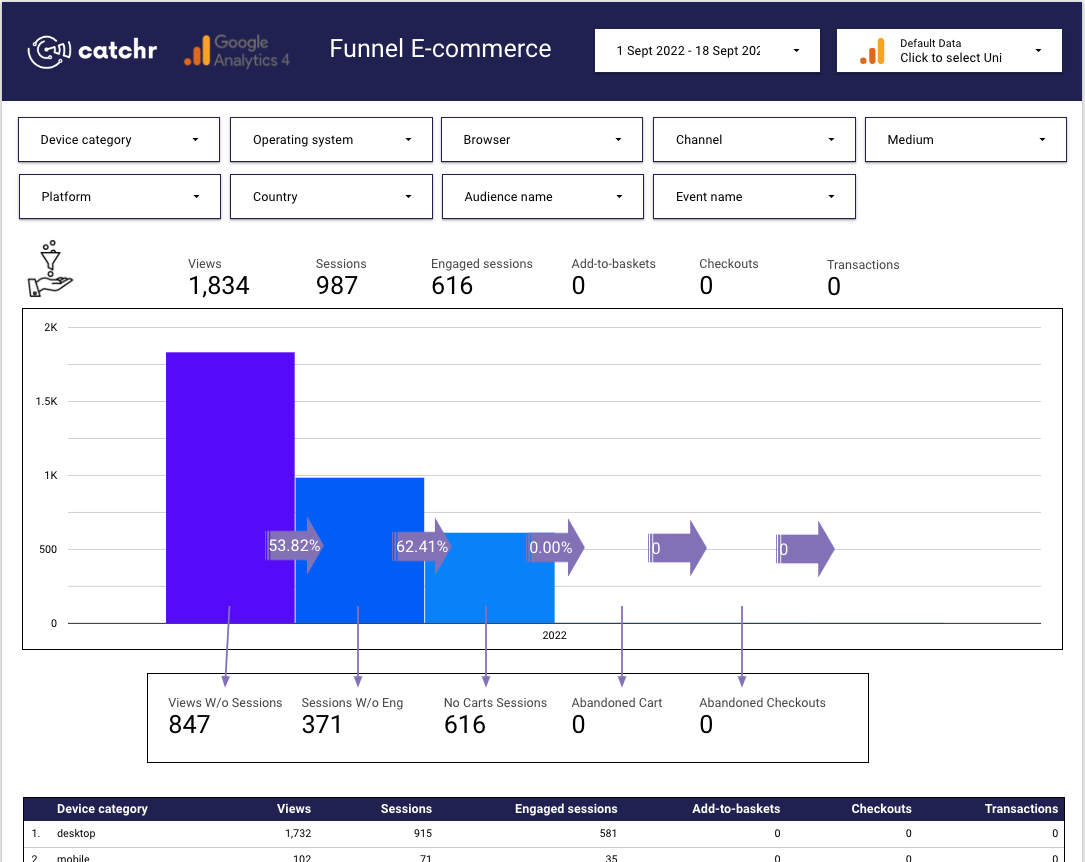
Visualize your user journey from first visit to conversion and identify where users drop off using the Google Analytics 4 funnel dashboard.
If you only need to track one GA4 property, the native connector is free and efficient. But for agencies, large websites, or advanced data needs, Catchr is the smarter, scalable solution.
Yes. You can connect multiple GA4 properties with a partner connector like Catchr. The native Google connector only allows one property per data source.
Yes. Both the native connector and Catchr automatically refresh your data daily.
Absolutely. You can blend GA4 with your ad platforms to get a complete overview of acquisition, engagement, and conversion performance.
Yes. The native connector now supports custom dimensions and events defined in your GA4 property. Catchr also supports them and allows you to use them across multiple properties without limitation. You can find the full list of Google Analytics 4 available fields on Catchr's documentation.
Yes. The native Google connector is free. Catchr offers advanced features, automation, and multi-account management with a free trial.
Connecting Google Analytics 4 to Looker Studio helps you visualize your analytics data, monitor user behavior, and make better decisions based on real-time insights.
Whether you use the free native connector or Catchr for advanced, multi-source tracking, Looker Studio transforms your GA4 data into actionable reports.
Once connected, you can focus on optimizing user experience and improving conversions instead of manually exporting reports.
Start using Looker Studio with a ready-to-use template
Get the template
Start analyzing your data with a Looker Studio template
Catchr provides free dashboard templates to help you start analyzing your data on Looker Studio — 100+ available templates!
See all the Looker Studio templatesStart using Power BI with a ready-to-use template
Get the template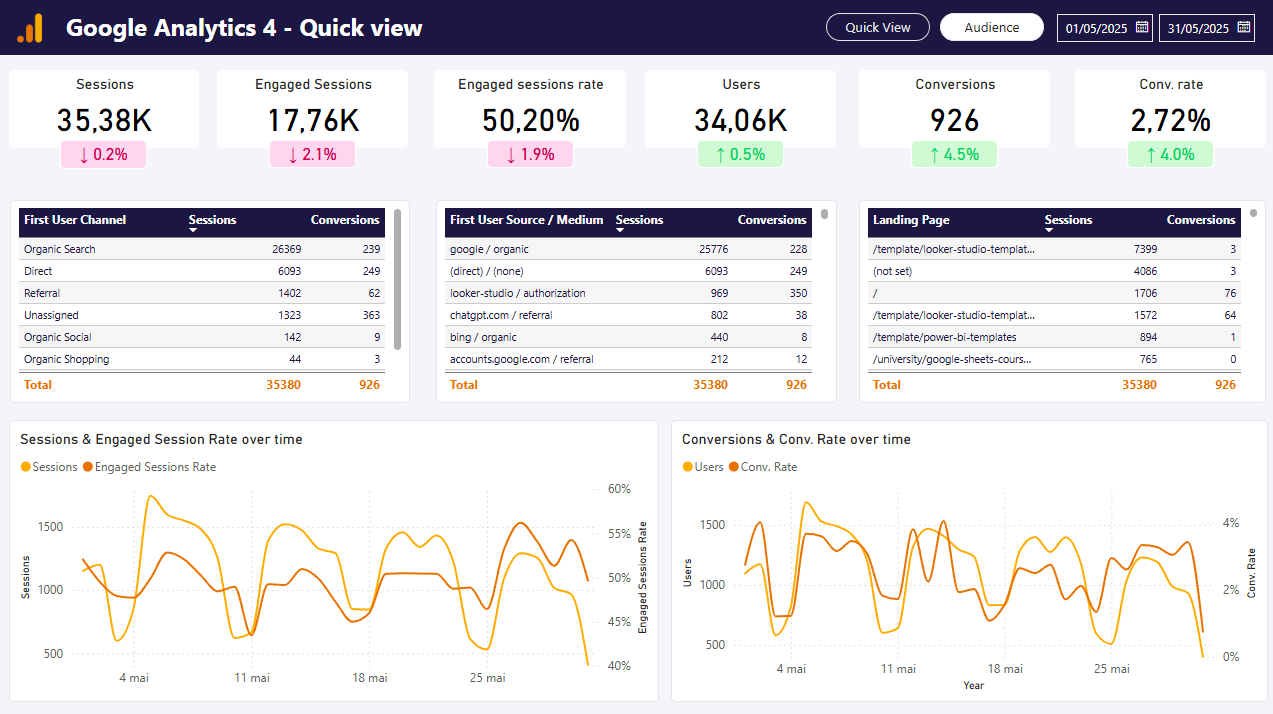
Start analyzing your data with a Power BI template
Catchr provides free dashboard templates to help you start analyzing your data on Power BI — 20+ available templates!
See all the Power BI templatesStart using Google Sheets with a ready-to-use template
Get the template
Start analyzing your data with a Google Sheets template
Catchr provides free dashboard templates to help you start analyzing your data on Google Sheets — 20+ available templates!
See all the Google Sheets templates✔ 14 days free trial — No credit-card required
✔ 14 days free trial — No credit-card required
Move your Marketing data to your favorite tools
Simplify your data extraction and move all your Marketing data to dashboard tools, spreadsheets, database and more... No code required!
75+ connectors | 20+ destinations
✔ 14 days free trial — No credit-card required


