blog post

Connect Facebook Ads to Looker Studio : How-to, templates and metrics

Johan Chemin
November 20, 2023
Connect Facebook Ads to Looker Studio : How-to, templates and metrics

Quick steps to create a Facebook Ads report with Google Sheets:

You can easiliy create a Facebook Ads report following this step :

  1. Get informations from the data integration from our Facebook Ads connector.
  2. Create a source on catchr.io.
  3. Download our Google Sheets extensions.
  4. Configure and run your request
If you need more informations, you can follow the tutorial.

How to install Google Sheets Catchr Add-on.

To start exporting your Facebook Ads data to Google Sheets, you need to install the Catchr add-on. You currently have two options :

Option A: Via the marketplace:

  1. Visit the Catchr Add-on page on the Google Workspace Marketplace and click "Install."
  2. Grant the necessary permissions for the add-on.
  3. Upon successful installation, open a Google Sheets to proceed.
Connect Google Sheet to Facebook Ads
Install Catchr Google Sheets Add-on

Option B: Directly within a Google Sheets:

  1. Open a new Google Sheets.
  2. In the top menu, click "Extensions", then hover over "Add-ons" and select "Get add-ons."
  3. Search for "Catchr" and choose "Catchr - data connector."
  4. Click "Install" and grant the required permissions.
  5. Close the installation pop-up when completed.
  6. Start using the Catchr add-on.
Install Catchr Add-on for Google Sheets

Once you have installed the add-on, you can start making requests.

The tutorial

Quick steps to create a Facebook Ads report with Looker Studio:

You can easiliy create a Facebook Ads report following this step :

  1. Get informations from the data integration from our Facebook Ads connector.
  2. Create a datasource and new report on Looker Studio.
  3. Choose your metrics and dimensions.
  4. Use charts with your metrics and dimensions.
If you need more informations, you can follow the tutorial. You can also find a template for Facebook Ads at the end of the page.

The tutorial

Quick steps to create a Facebook Ads report with PowerBI:

You can easiliy create a Facebook Ads report following this step :

  1. Get informations from the data integration from our Facebook Ads connector.
  2. Create a source on catchr.io.
  3. Configure your request on the PowerBI request manager.
  4. Copy the given URL in PowerBI
If you need more informations, you can follow the tutorial. You can also find a template for Facebook Ads at the end of the page.

The tutorial

Running PPC campaigns on Facebook Ads is unavoidable when you try to sell online. With more than three billion users monthly, Facebook Ads is one of the best-performing social media. It is best to use it when trying to overgrowth a business.

But you need more than just Facebook Ads for your business. You will also need a way to create a dashboard and analyze your campaign performance.

That's when Looker Studio comes in. Looker is a free tool developed by Google. It allows you to create charts and dig into your data quickly.

We will see in this tutorial how to create your first Facebook Ads report for Looker Studio.

How to create a Facebook Ads data source in Looker Studio?

First, you need to understand how Looker Studio works. You have two main entities: reports and data sources. A report uses a data source to access data and display it.

So let's create our Facebook Ads data source and then a report. 

To create a data source, you must use a partner connector. You can learn more about data sources and connectors on this page.

To access our Facebook Ads connector for Looker Studio, follow this link, and click Connect in Looker Studio green button.

Go to Catchr's Facebook Ads connector for Looker Studio.

You arrive in the Facebook Ads connector in Looker Studio : 

  • Click Authorize to log in or create an account on Catchr.
Login to Catchr
Login to Catchr
  • Click Authorize again to connect Catchr and your Google account.
Authorize Catchr to connect to a Google account
  • And click Authorize to link Facebook Ads, Looker Studio, and Catchr.
Authorize Looker Studio and Catchr to connect to Facebook Ads.

Once these three steps are over, you will access the configuration of the data source:

  • First, select your account.
Select a Facebook Ads account

Then select the configuration (if you don't know what to choose, you can skip this part and modify it later, the default configuration will be applied).

For the left column:

  • Attribution Window: The attribution used in the report. If blank, the default configuration will take 7 days clicks / 1 day views.
  • Unified Attribution Settings: If checked, your result will be shown using the ads attribution settings, and the Account Attribution Settings will be ignored.
  • Account Attribution Settings: If checked, your result will be shown using the account attribution settings.
  • Report time of action stats: The action from where your conversion will be reported. If blank, the default configuration will be on impressions.

For the right column: 

  • Each checkbox allows the configuration on the left column to be editable in your charts' report. You'll see this in the configuration panel:
Configure your Facebook Ads data source

Uncheck the Use report template for new report options. We want to start a blank new report.

Finally, click Connect on the top right to create your Facebook Ads data source on Looker Studio!

Connect your Facebook Ads data source.

The next page you'll see is the field list of your data source. Every field you see here is usable in a report.

One last tip before creating your report: rename your data source at the top right. It will be easier to find later.

Rename your Facebook Ads data source.

Now that your data source is configured, connected, and renamed, we can proceed.

How to create a Facebook Ads report in Looker Studio?

From your Facebook Ads data source, click on Create report at the top right.

Create your Facebook Ads report from your Facebook Ads data source

This new page is your new report. Start by renaming it at the top left.

You can learn more about this interface on this page.

Rename your Facebook Ads report

Now we need to decide what we want our report to show and which metrics and dimensions I want to use.

Which metrics and dimensions to choose to create your Looker Studio report?

Facebook Ads metrics:

I aim to lead the user on my website and make him purchase my product. So here's the list I will use :

  • Spend -> How much I spend on Facebook Ads campaign.
  • Impressions -> The number of time my ads was shown.
  • Reach -> The number of Facebook users who saw an ad.
  • Cost per Mille -> Cost for 1000 impressions to better understand an ad's cost.
  • Outbound Clicks -> Clicks that lead to my website (if you'd rather have all the clicks that lead to your content on and out of Facebook, you can use the Link Click).
  • Cost per Outbound Click -> To know how much an outbound click costs.
  • Adds to cart -> The number of add-to carts on my website.
  • Cost per Add to cart -> To know how much an adds to cart costs
  • Purchases -> The number of purchases on my website generated by a Facebook ad.
  • Cost per Purchase -> what the costs of a purchase.
  • Purchases Value -> Revenue generated by my ads.
  • Conversion rate -> The percent of people that purchased after a click on a Facebook ad that led to my website.
  • Return on Ads Spend (ROAS) -> Revenue generated for every euro spent on my ads.

These metrics will give me a good idea of my ads' performance. I could have included more metrics like the Leads and Cost per Lead or the Landing page views, but I did not want to surcharge my report. Instead, I might include them in a website focus page.

Custom metrics and custom events:

I won't use any custom metrics or custom events in this report, but you can find yours in your data source:

  • Custom Conversions are prefixed with "- custom conversion".
  • Custom events are prefixed with "- custom event" and are only available for the last 30 days.

If you cannot find one, please ensure your data source is only connected to 1 account. Data sources created with multiple accounts will only have shared metrics and dimensions, therefore, not have the custom one.

Facebook Ads dimensions:

I choose all the metrics I need. Now, let's select the dimensions to break down these metrics:

  • Campaign name -> General campaign breakdown, give me the performance of each campaign.
  • Objective -> To use a dynamic filter to filter the entire report quickly.
  • Date -> To check on the evolution.

Since IOs 14.5, it's irrelevant to use breakdowns like age, gender, and country. So instead, you better name your campaign and ad set with all these pieces of information and use calculated fields to extract them (this will be a subject for another blog post, link coming soon).

You can find the complete list of metrics and dimensions on the data source or in our academy.

Adding charts to your report:

We choose the metrics and dimensions, but before using them, we will just add a Date Range Selector.

Date range selector:

Add a date range selector to your report. It will let your viewers filter the temporality of the result display.

  • Click Add a control, then Date range selector, and place it in the report.
Add a date selector to your Looker Studio report.

You can fix your default date range instead of the "last 28 days" used.

Change the default configuration of your data time selector.

Now let's use the metrics and dimensions !

Scorecards:

To start, we will place a line of cards with the global metrics :

  • Click on Add a chart, then Scorecard. Place it on the canvas.
  • In the configuration panel, choose impression.
Add a scorecard to display a global metric.
  • Add the comparison options.
Add the comparison to the previous period to a Looker Studio chart.

We place our first card. As I want to save time, we will add a style and copy this card instead of recreating it:

  • Select the card and go to the Style panel.
  • Increase the font size.
  • Align the texts in the middle.
  • Add a border and a border-radius.
Style your scorecard.

Now copy and paste this card and change the metric for Reach. You can repeat this action for every base metric. 

Copy your scorecard and change the metric.

For the calculated fields, proceed like this:

  • Copy and paste a card
  • Open the metrics list and click Create a calculated field at the bottom.
  • Name your new field and enter a formula.
  • Give it a type (currency or percent)
Create a calculated field.

Here are the formulas for all calculated fields:

  • Cost per Mille (CPM) : SUM(Spend)/SUM(impressions)*1000
  • Cost per Outbound Clicks : SUM(Spend)/SUM(Outbound clicks)
  • Cost per Adds to Cart : SUM(Spend)/SUM(Adds to Cart)
  • Cost per Purchases : SUM(Spend)/SUM(Purchases)
  • Conversion rate : SUM(Purchases)/SUM(Outbound clicks)
  • Return on Ads Spend : SUM(Purchases Values)/SUM(Spend)

Once set up, we can align them perfectly :

  • Place the first one and the last one.
  • Select all scorecards in the canvas.
  • Distribute them: right-clicks, Distribute, and Horizontally.
  • Align them to the top: right-clicks, Vertical Align, and Top.
Distribut and aligne your scorecard

Great, we finished the setup for overall metrics. Let's do the breakdown now!

Table:

We will use a table for the breakdown by Campaign name and Ads creative image:

  • Click Add a chart, then Table. Place it in the report.
  • On the configuration panel, select the dimension Campaign name.
  • Add all the metrics.
Add and configure a table

Time series:

Let's use a time series for our evolution by day. I want to know two things:

  • First, the difference between spend and revenue.
  • Second, the growth of the number of outbound clicks and how much it costs me daily.

To do so :

  • Click Add a chart, then Time series, and place it in the report.
Add a time series to your report.
  • In dimension, select Day. In metrics, choose Outbound Clicks and create a calculated field for the Cost per Outbound Clicks
configure metrics and dimension for your time series.
  • Change the style to bar charts to identify the day with less revenue than spent.
Change line to bar chart for your time series.


Filter by Objective:

Sometimes, even if your main goal is user purchases, you can define other objectives for some campaign (notoriety, for example). You can set up a dynamic filter with the different objective types by doing this:

  • Click Add a control. Select the Dropdown list. Place it in the report.
  • Use Objective in the dimension.
  • Filter your data.
Add a dropdown selector to your Looker Studio report.


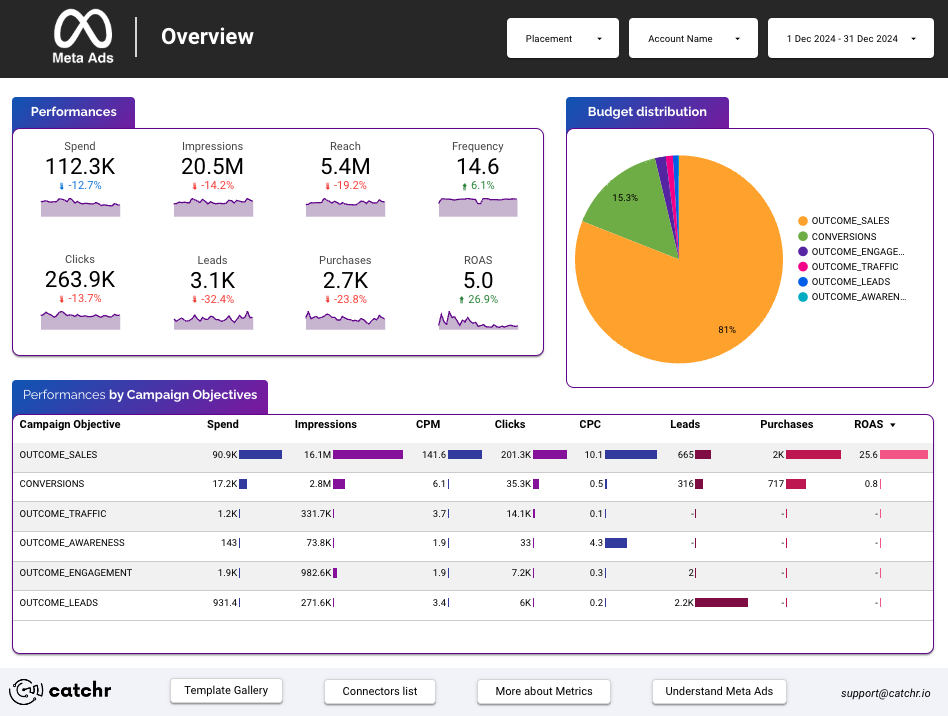
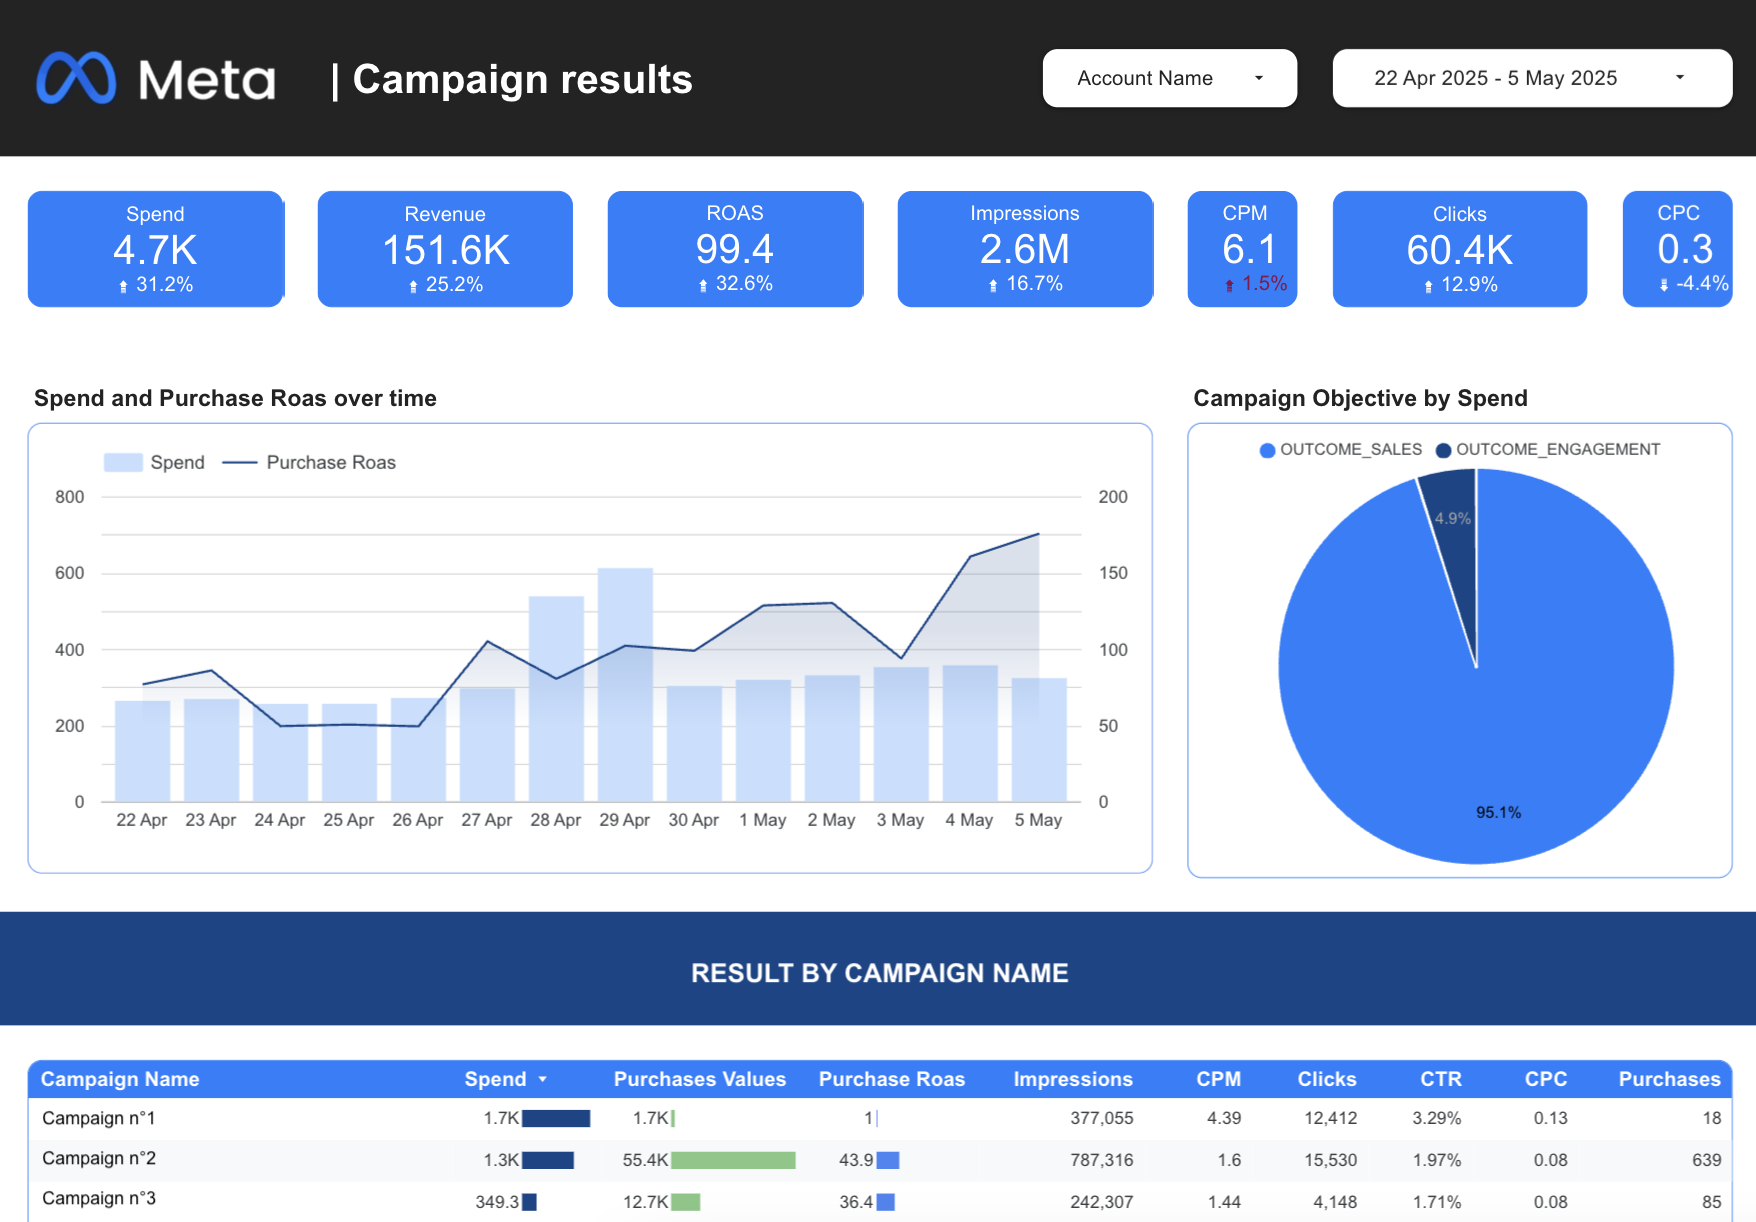
Bonus : Your free Template Meta Ads - Overview V2 Template

In this Facebook Ads template, you will find all the metrics and dimensions you would need to get a better view of your data.

If you need more templates, you could look at our looker studio template gallery.

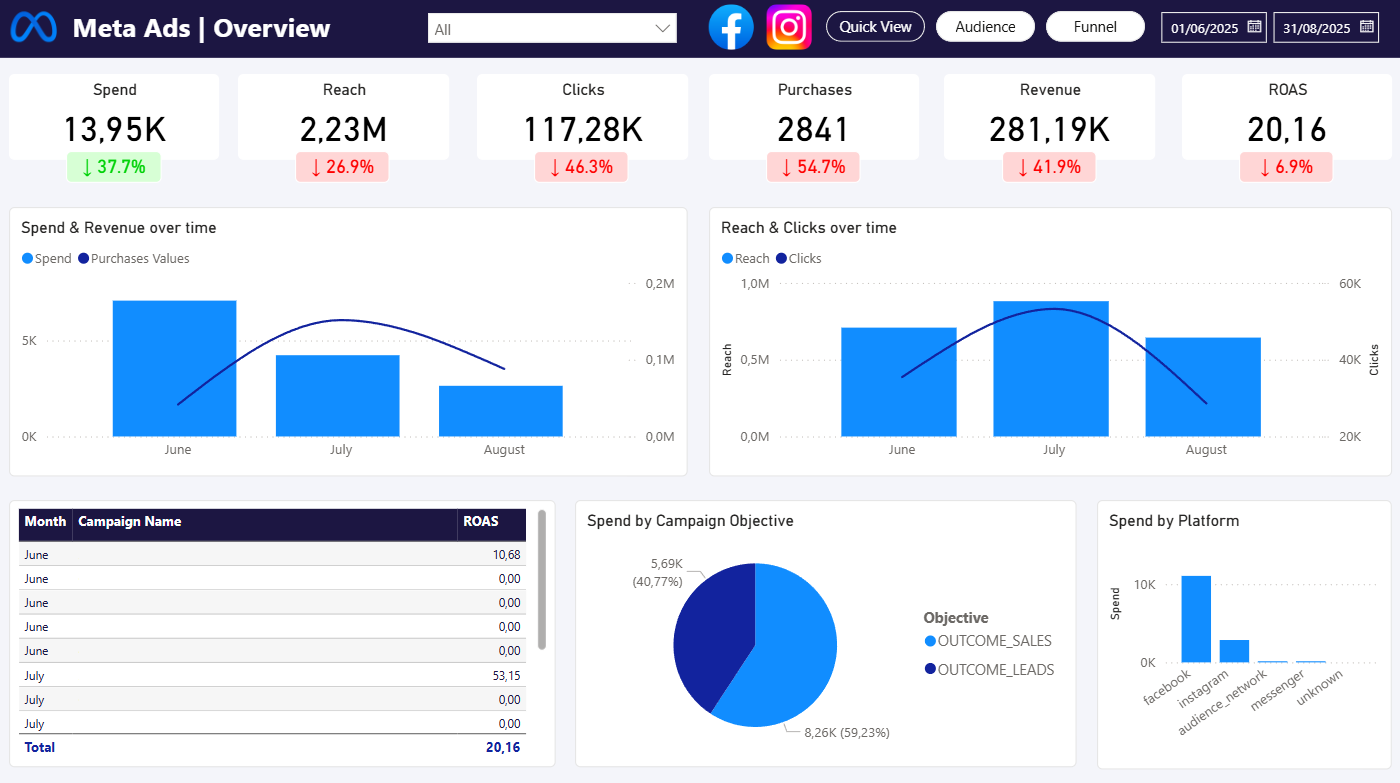
Bonus : Your free Meta Ads OverviewTemplate for PowerBI

In this Facebook Ads template, you will find all the metrics and dimensions you would need to get a better view of your data thank to our integrations.

If you need more templates, you could look at our PowerBI template gallery.

Unlock Insights with Style!

Transform your marketing data into stunning dashboards.

Integrate, visualize, and impress with Catchr's seamless dashboards. Elevate your data game now!
Build your first report
14 days free-trial - No credit card required 🎉

More blog post about Facebook Ads

Explore your Facebook Ads Marketing KPI in PowerBI : How-to, metrics and templates

Master the art of integrating Facebook Ads with PowerBI through Catchr with our in-depth tutorial. Learn to connect, transfer, and visualize crucial marketing metrics for enhanced analysis and strategy development. Transform your Facebook Ads data into insightful, actionable PowerBI reports today!

Florian Cabirol

Top 8 Facebook Ads KPIs Every Marketer Needs to Keep Up With in 2023

Discover the top 8 Facebook ads KPIs to optimize your marketing campaigns for better reach and enhanced performance. Read our latest blog to learn more!

Florian Cabirol

Connect Facebook Ads to Looker Studio : How-to, templates and metrics

Import your Facebook Ads data into Looker Studio and create a report with this step-by-step tutorial!

Johan Chemin

How to Import Facebook Ads Data to Google Sheets: A Comprehensive Guide

Learn how to import Facebook Ads data to Google Sheets using the Catchr Add-on. Analyze and visualize your marketing data with ease and efficiency.

Florian Cabirol