Why is Looker Studio a reference tool in marketing?
Discover Looker Studio’s features, benefits, and limits, and see how it aligns with the main criteria for choosing the right reporting tool.
Every marketing action is an investment, and it’s essential to measure its impact. Platforms do offer native dashboards, but they’re limited: hard to cross-reference with each other and quickly time-consuming to use as channels multiply. Result: your teams spend more time producing reports than analyzing and acting.
Looker Studio (formerly Google Data Studio) meets this challenge by centralizing all your sources, automating collection, and offering a living, shared dashboard. The goal isn’t just to aggregate numbers, but to bring data closer to action.
But then, Is Looker Studio really suits your needs and how does it stack up again its peers?
Key criteria for marketing data visualization tools
To assess where Looker Studio stands in the marketing reporting ecosystem, we first need to define a set of criteria that make a marketing data visualization tool “good". At Catchr, we align on five key criteria that would make a marketing tool a strong choice.
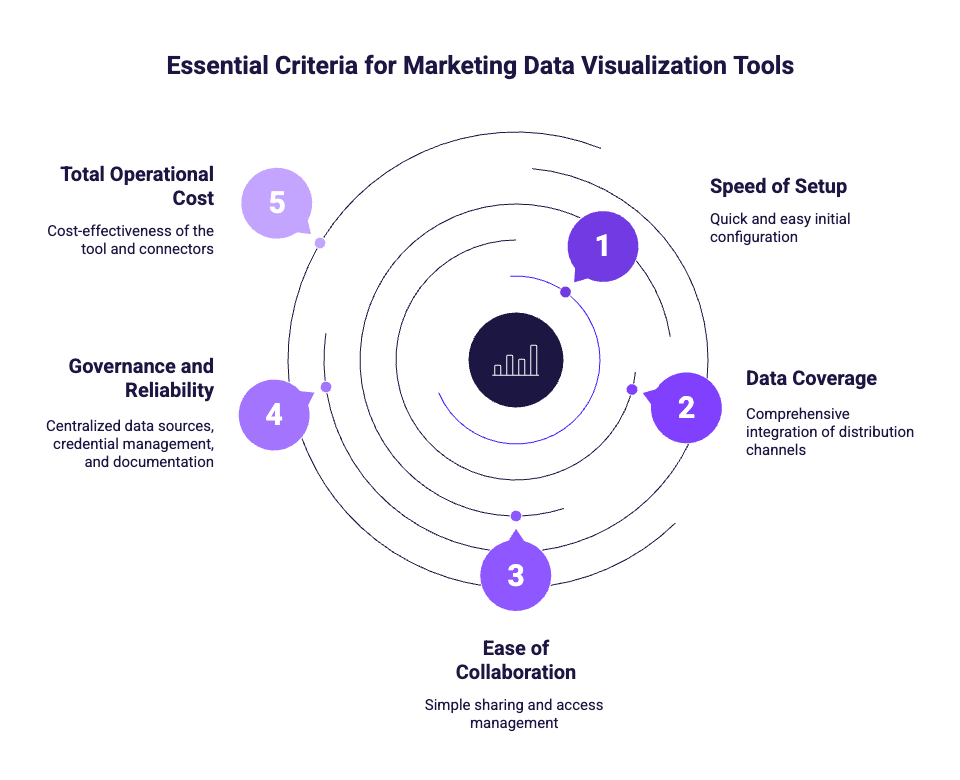
- Speed of setup: Hours, not weeks. The tool has a template system. You can easily add your source. You can set up your first reports smoothly.
- Data coverage: The source ecosystem is rich and implements all of the company’s distribution channels (natively or via community connectors like Catchr).
- Ease of collaboration: You can easily share reports with other team members, manage access to these reports with solid granularity, and leverage distribution tools that are simple to set up.
- Governance and reliability: Data sources are centralized in the tool so you don’t have to add them every time. There is credential management for access to these sources. Documentation of the various fields available for each source is provided.
- Total operational cost: The cost of the tool and connectors should outweigh the cost of rolling the tool out across the organization.
On top of these criteria come strong project constraints
- Amount of data to retrieve: Channels with lots of daily data or requiring very fine granularity can consume significant extraction time, lengthening rendering times.
- Data freshness: Needing to fetch data that’s more or less up-to-date can prevent the use of certain extracts aimed at sources with large data volumes.
And what about Looker Studio?
Based on the criteria defined above, Looker Studio is a very strong performer. It checks all five boxes.
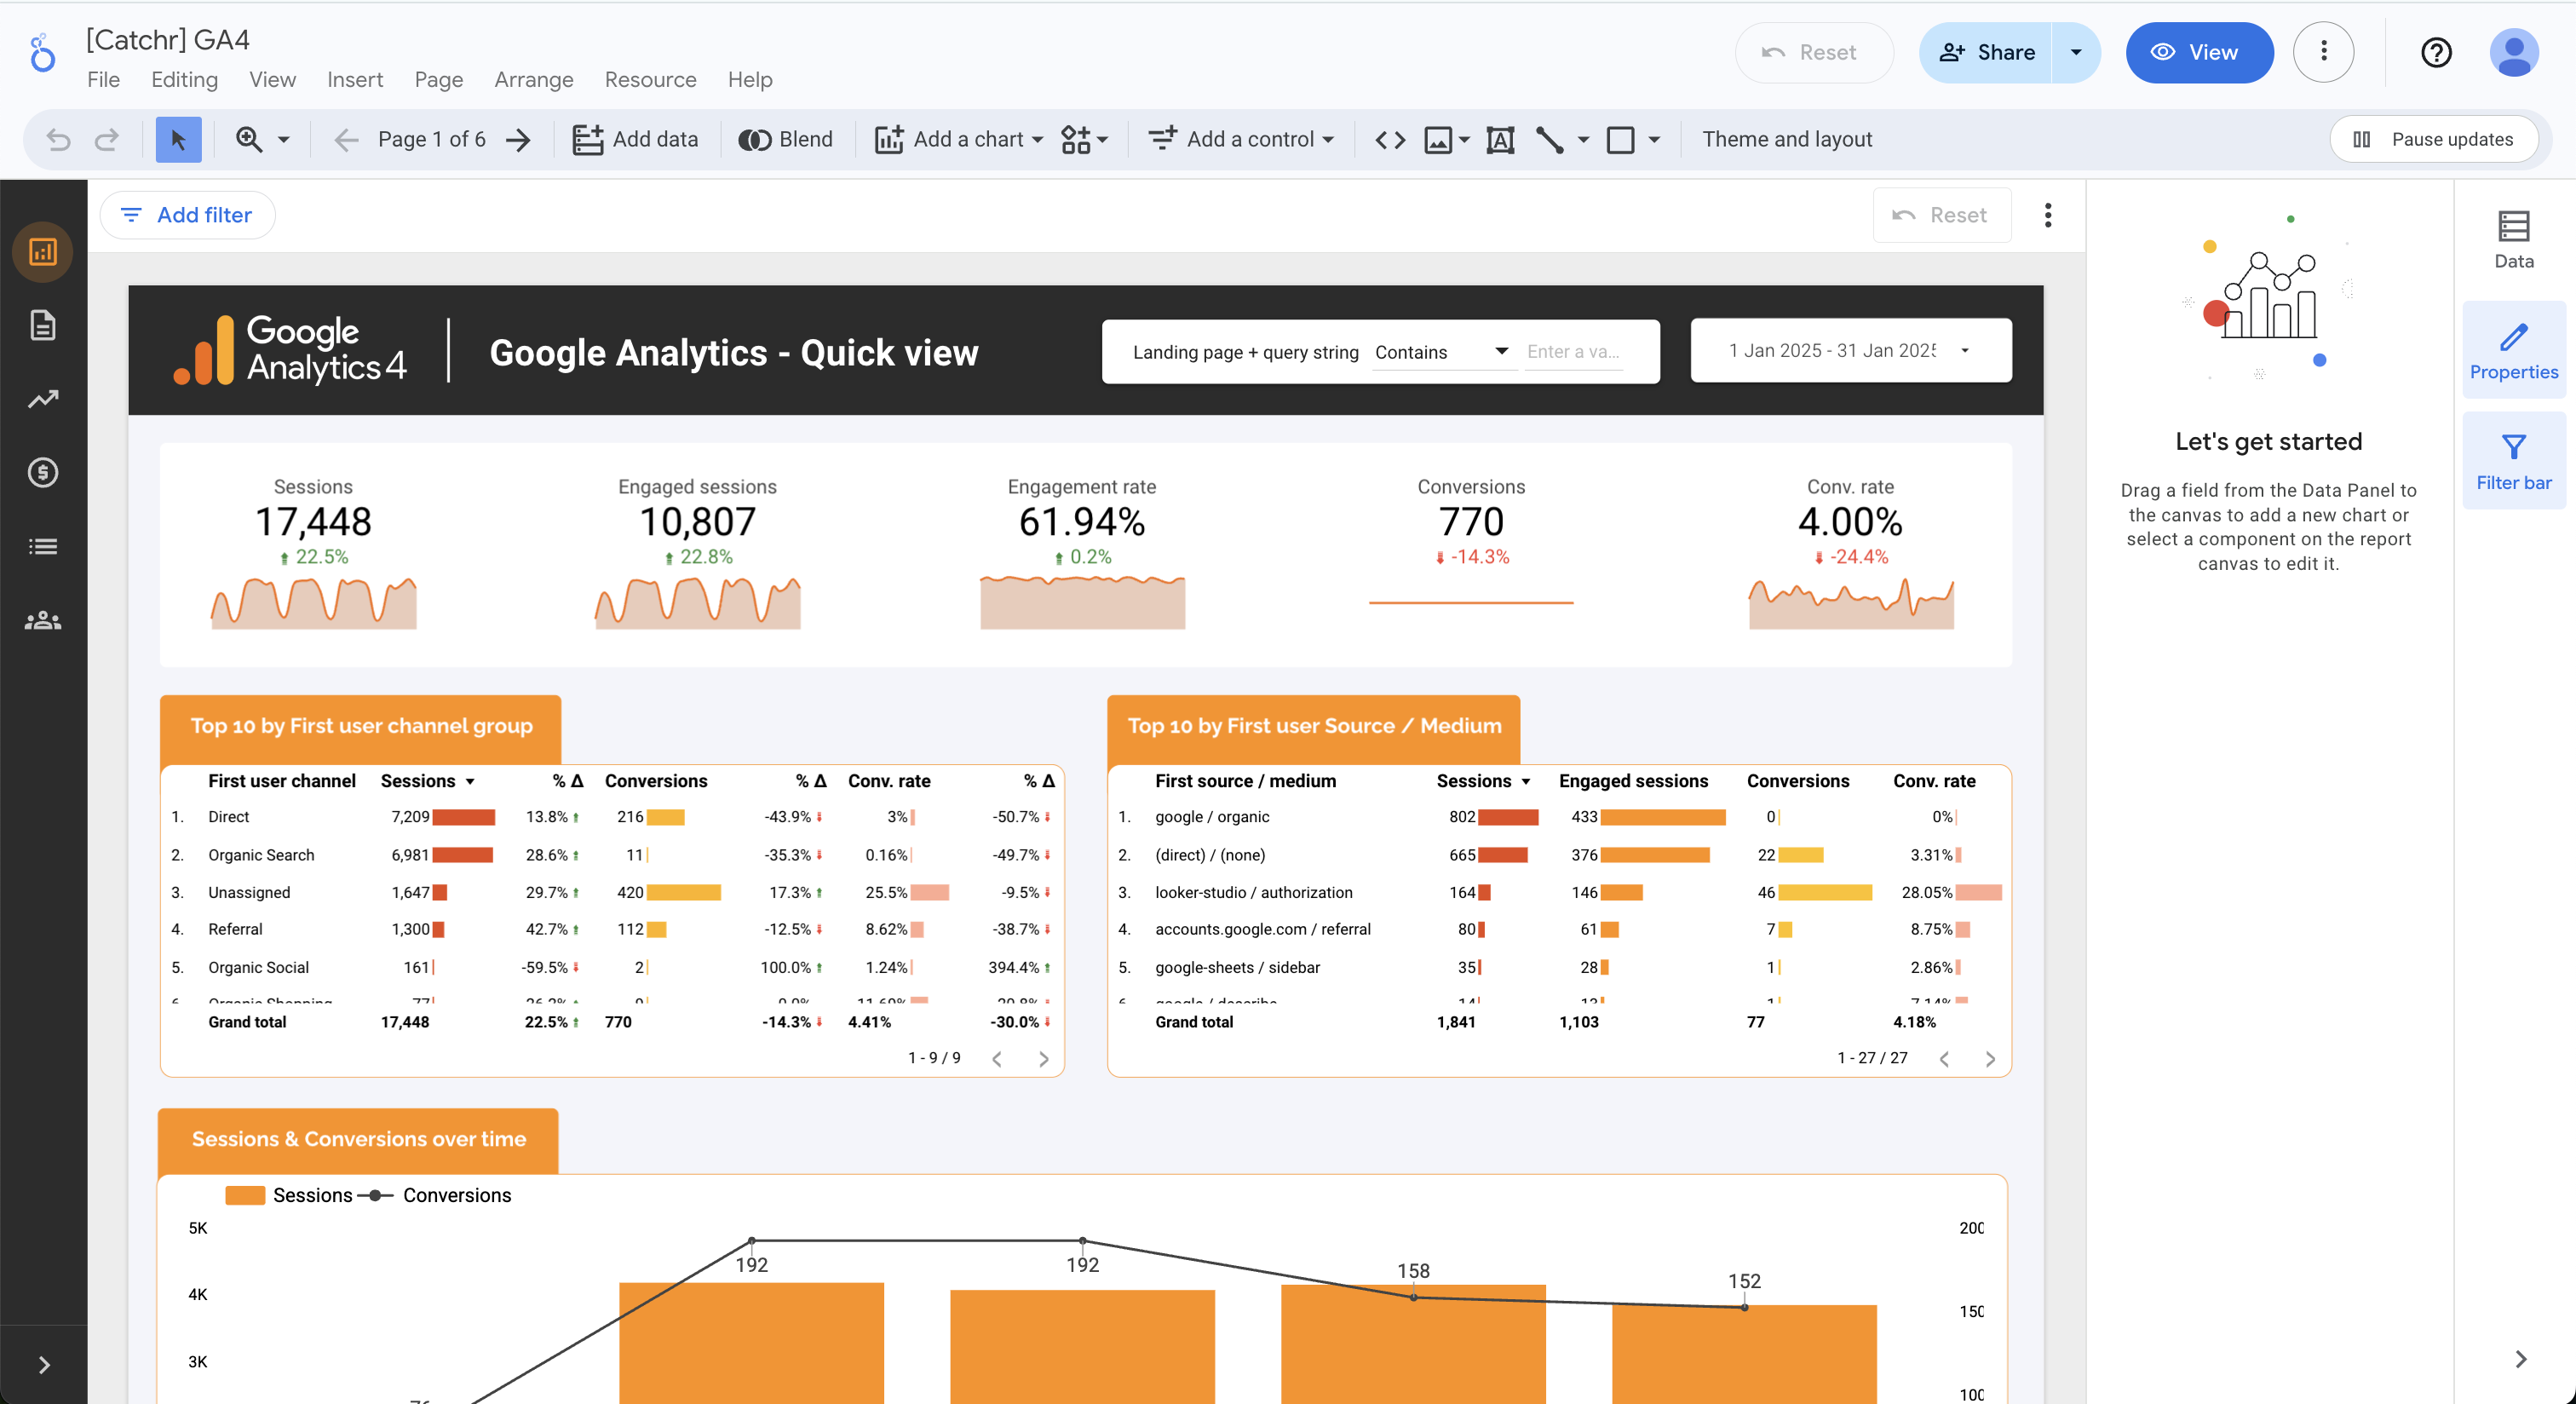
Intuitive interface and onboarding
With its powerful WYSIWYG (What You See Is What You Get) report interface covering numerous controls (filters, date ranges, lists, parameters), as well as a modular dashboard system backed by a large library of native and community components, any user can build their first report in a matter of hours. What’s more, thanks to a large existing community, plenty of tutorials are available online to get off to a good start. You can also find a Catchr's complete tutorial for getting started with Looker Studio.
Diversity of implemented sources
One of Looker Studio’s strengths lies in its ecosystem. Integrating its own services as native connectors (24 connectors), the tool also allows the addition and validation of community connectors (including Catchr), covering a very large portion of possible channels (1,267 partner connectors as of October 2025). There’s little chance you won’t find the connector you need in the store. If you don’t find a platform on the marketplace, you can request its addition through our feature request system. The most requested features are then added by our team to meet your needs.
Granular sharing for better collaboration
It’s also a tool that enables fairly simple collaboration, which will greatly facilitate adoption by your team and your clients. The ability to share reports by link along with granular view or edit permissions lets you share a report with colleagues or clients alike. You can also add comments to provide context, export the report to PDF, or send it by email automatically.
A two-level permission system and built-in governance features
For governance, the tool lets you assign rights at the report or source levels and includes a data source library so sources can be reused across reports. The tool also provides a field listing per source, as well as calculated fields so you can add your own custom fields. You can also create data blends to link multiple sources together via a join key.
Minimal costs
Finally, the tool is free. The only potential costs would be subscriptions your company needs to take out with its connector provider, and, if needed, any costs related to your data warehouse (such as BigQuery, for example). The total operational cost is therefore quite low.
If you’re considering using Catchr as your connector provider, you can find informations about our pricing.
So, what are the limits?
Even though Looker Studio performs well in many cases, it’s important to highlight a few frequently encountered limitations.
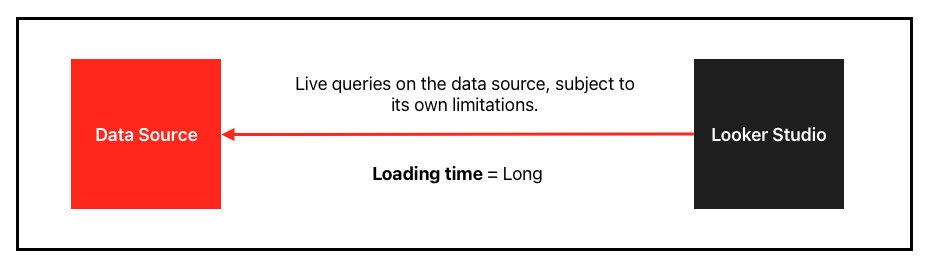
Limited performance on blending
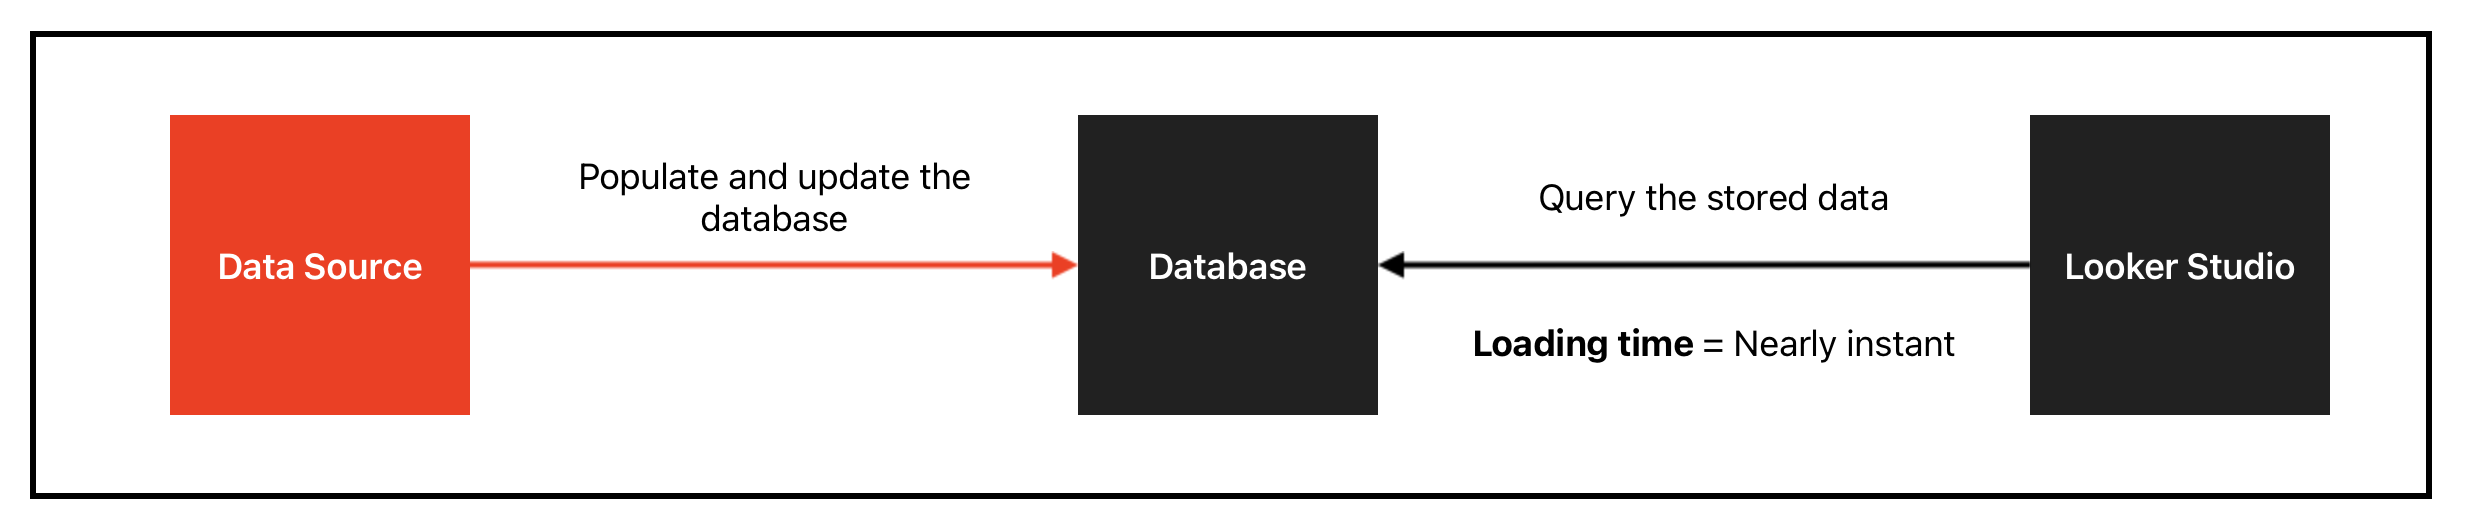
While blending works well with a small number of sources and low granularity, performance drops sharply when higher granularity is required or too many sources are queried. You can work around this by doing upstream extracts to BigQuery or Sheets, then using native connectors to read the data.
Limits of Looker Studio’s operating model
Looker Studio dashboards can run into performance issues when too many components are displayed. Each component triggers one or more queries, and community connectors are limited to 30 parallel calls (50 for Google connectors). Exceeding this limit causes data to fail loading. To address this, you can reduce components per page, use caching and scheduled refreshes, or rely on BigQuery extracts with the official connector to benefit from higher query limits and faster performance.
Platform-related limits
Each connector has its own specifics (quotas, API speed), and retrieving too large a date range at once can sometimes be complex, or even impossible.
Here again, preparing automatic exports to a data warehouse can be a solution.
Connector quality depends on the provider
Finally, the quality of the third-party connector used can directly influence adoption of the tool. It’s generally best to make sure the targeted connectors properly implement the required fields. If you want to use Catchr's marketing connector, you can find all the available fields for each one in our documentation.
Looker Studio alternatives
You can consult the appendix comparing different data visualization reporting services to get a sense of the landscape.
Conclusion
Ultimately, Looker Studio strikes a good balance between performance and speed of report setup. With its smooth collaboration features, very wide interoperability with almost all existing sources, flexibility in data presentation, and large number of components, the tool stands out as a reference among collaborative reporting tools for marketing. In addition, its native integration with BigQuery helps offset certain shortcomings around slowness and the limits of data blending.

