Export a Data Studio Report or Component (PDF & CSV)
Learn how to export Data Studio (formerly Looker Studio) reports to PDF and charts to CSV/Excel/Sheets. Plus, discover Catchr’s Sheets add-on to avoid repetitive exports.
Exporting is one of the simplest ways to share Data Studio (formerly Looker Studio) insights outside the platform. Whether you need a clean PDF for a meeting or raw table data to analyze in Excel, Data Studio provides built-in export options for both full reports and individual components.
This guide walks you through:
- exporting a report to PDF
- exporting a chart or table to CSV / Excel / Google Sheets
- controlling and limiting who can export
- common errors, limits, and troubleshooting
Prerequisites
Before exporting anything, make sure:
- You have access to the report.
You need at least Viewer access. If the report owner disabled exporting, you won’t see export options.
- You’re in the right mode.
- Report PDF export works in both Edit and View mode.
- Component export is typically done in View mode, via the chart’s three-dot menu.
- Your filters are set correctly.
Exports are snapshots of what you’re currently seeing, including filters and date ranges.
Why use the Export feature?
Even though Data Studio is built for live, collaborative dashboards, exporting becomes essential when marketing teams need to:
- Share results outside the tool
- Capture a reliable snapshot
- Dig deeper into performance.
In practice, exports are mainly used to send weekly or monthly updates to stakeholders or clients who won’t open Data Studio, freeze end-of-campaign results for recaps or archiving, and pull chart data into Excel/Sheets for deeper analysis, budget planning, or slide-ready reporting.
How to export a report from Data Studio (PDF)
Use PDF when you want to share the full dashboard story:
- Weekly marketing performance report (traffic, leads, spend, CAC/ROAS).
- Monthly client or leadership reporting.
- Final campaign recap (launch, promo, event).
Steps
- Open your Data Studio report.
- Click on the arrow next to Share.
- Select Download report.
- Choose:
- All pages or selected pages
- optional PDF settings (when available), such as:
- Ignore custom background color
- Add a link back to the report
- Password protect report
- Click Download.

How to Export a Component from Data Studio (CSV)
Use CSV when you need the data behind one chart/table:
- Export campaign-level performance to pivot spend vs conversions.
- Pull top landing pages/keywords for SEO prioritization.
- Extract email/CRM results by segment for deeper analysis.
- Share a specific KPI table with another team (sales/finance).
Steps
- Open the report in View mode.
- Hover the chart or table you want to export.
- Click the three-dot menu (⋮) in the top-right corner of the component.
- Choose Export data.
- Select your export format:
- CSV
- CSV (Excel)
- Google Sheets (if enabled)
- Confirm to download or generate the file.

From one-off CSVs to live marketing sheets
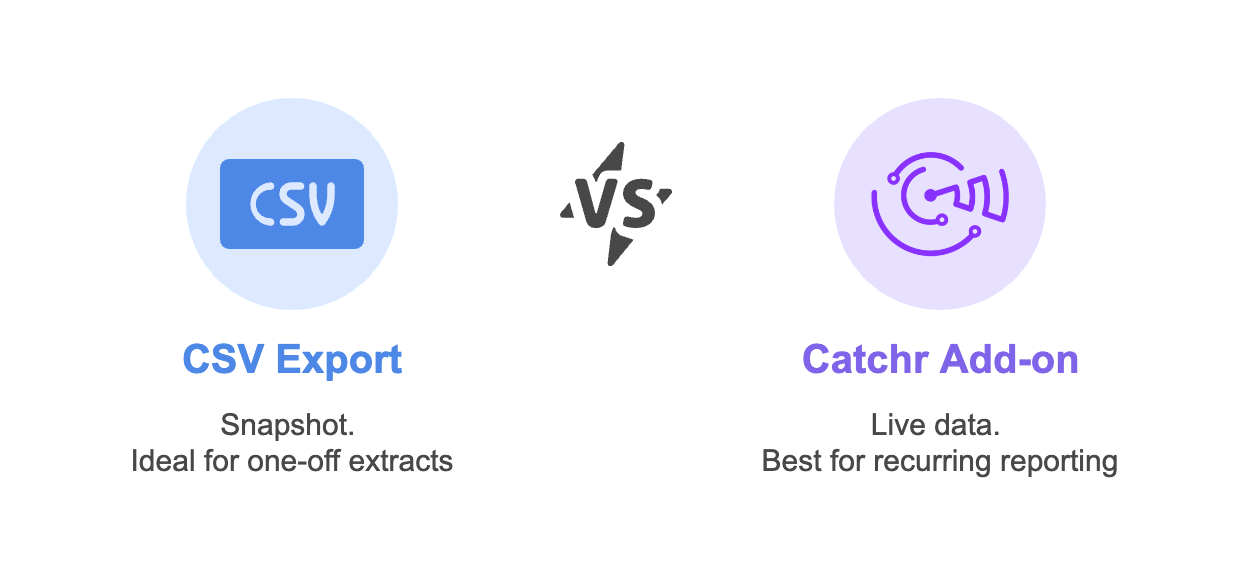
Exporting a component to CSV is often the fastest way to grab the data behind a chart and continue your analysis in a spreadsheet. But if you find yourself exporting the same tables every week (for campaign pacing, SEO prioritization, or budget tracking) it can quickly become repetitive. That’s exactly where the Catchr Google Sheets add-on comes in: instead of exporting a snapshot from Data Studio, you can pull the data directly from the source into Sheets, refresh it automatically, and build your analysis on top of live numbers.
In short: CSV export is perfect for one-off extracts, while the Catchr add-on is built for recurring, source-level marketing reporting.
Export permissions
Sometimes you don’t want viewers to export data, especially for sensitive dashboards.
Report owners can disable exporting via advanced sharing settings:
- Click Share on the report.
- In the sharing window, click the gear icon (Advanced sharing options).
- Enable Disable downloading and printing for viewers.
Once enabled, viewers won’t see Download report or Export data options.

Errors & Limits
Data Studio exports are powerful, but not unlimited:
- Exports are snapshots, not live files. If your report updates tomorrow, your exported PDF/CSV doesn’t.
- Row limits exist for component exports. Data Studio allows exporting up to 750,000 rows per chart export. If you need more than that, you’ll usually need to export directly from the source.
- Large PDFs can be heavy or incomplete. Long pages or very large tables may not render perfectly in PDF exports.
- Permissions still apply. If a viewer doesn’t have access to the underlying data source, they may see export disabled or partial data.
Troubleshooting
Here are the most common export issues and how to fix them:
Download report / Export data option not available
- You only have view-only access AND exporting is disabled by the owner.
- Ask the owner to allow exports in Advanced sharing options.
PDF is cut off or looks different
- Check page size and layout first.
- Finalize filters, then export from View mode.
- If you used a custom background, try toggling Ignore custom background color.
The CSV doesn’t match the screen
- You probably exported with different filters/date ranges.
- Re-check all report controls before exporting.
Export is missing rows
- You may have hit a row limit or an aggregation setting.
- Try exporting a table with fewer dimensions or validate directly in the data source.
Conclusion
Data Studio (formerly Looker Studio) is designed for live, collaborative reporting, but exporting is what makes marketing insights portable. Use PDF export when you need a polished, share-ready dashboard for weekly updates, clients, or campaign recaps. Use component CSV export when you want to go deeper on a single chart, to analyze performance, prioritize actions, or plan budgets in Sheets. And when those CSV pulls become a recurring routine, the Catchr Google Sheets add-on lets you skip manual exports by extracting the data directly from the source and keeping your spreadsheet analysis always up to date. With these options, you can move smoothly from dashboards to decisions, without losing time on repetitive reporting.
