In the thriving field of digital marketing, the necessity for efficient data analytics has never been greater. The administration, extraction, and analysis of data from an ever-growing variety of sources is a hurdle that all marketers face. Due to this task's extreme complexity, useful insights may go unused, which would limit a brand's ability to make data-driven choices.
Real-time insights, dynamic reporting, and smooth data processing are necessities in our era. The outmoded technologies and conventional procedures sometimes fall short, leaving marketers feeling overpowered by the growing amounts of data.
But with so many choices, it's easy to get confused about which product would work best for your particular marketing requirements. With each having unique features and capabilities, choosing one might be difficult.
To assist you with making a wise choice, we'll explain the intricacies of these marketing analytics tools in this post. We'll also discuss a potential third option that can become your hidden weapon in the field of marketing reporting.
What is Supermetrics?

Supermetrics is a well-known brand in the world of marketing analytics, and it is renowned for the extensive variety of data connectors that it offers with well-known analytics and reporting systems.
It makes it possible for marketers to effortlessly extract data from sources such as Google Analytics and Facebook Ads, as well as other sources, and then turn that data into meaningful insights by using tools such as Google Sheets, Excel, Tableau, and PowerBI.
To get to know Supermetrics better, you can start with a 14-day free trial, without a credit card required.
For more information, check out Supermetrics.
What is Whatagraph?

The one-stop shop for linking, visualizing, and sharing your marketing data is Whatagraph. Bid adieu to the time-consuming data-related duties that used to drag your team down.
You can simply generate spectacular reports using Whatagraph, link your data sources with ease, and publish them with ease.
Additionally, it enables you to easily disseminate data to your stakeholders or move it to BigQuery. Utilizing Whatagraph will not only make your data processing simpler, but it will also save time that can be used for other aspects of your marketing initiatives.
You can check out this tool with the 7-day free trial.
Visit Whatagraph to find out more.
Which One is Ideal for Whom?
Before getting into a full comparison, it's important to realize that the best option between Whatagraph and Supermetrics will rely on your unique demands and tastes.
For data-driven marketing professionals who want access to several sources and analytical tools, Supermetrics is a flexible option. It's especially useful for those who depend on Google Sheets a lot and need a range of connectors.
Supermetrics is ideal for small and middle-sized businesses and organizations, solopreneurs, freelancers, and marketers.
On the other hand, Whatagraph is a fantastic option for people or groups seeking a user-friendly, visual report production solution. It is perfect for marketers who value report aesthetics and want to speed up the reporting process.
Whatagraph seems best for large-scale firms and enterprises and bigger teams.
How Supermetrics Differs from Whatagraph - A Quick Overview
Let’s take a quick glimpse at what Supermetrics and Whatagraph have to offer:
Supermetrics Vs Whatagraph - A Detailed Comparison
Let's dissect the comparison into a few key components so that you can get a thorough insight.
Data Connectors
Supermetrics prevailed in this contest because of its extensive array of data connectors. Supermetrics can let you extract data from databases, online analytics systems, or advertising networks. Supermetrics is a powerhouse for thorough data collection and analysis with 100+ links to Google Sheets, Looker Studio, Tableau, PowerBI, Big Query, and more.

WhatAGraph offers 100+ connectors, depending on the subscription plan, with important data sources including Google Analytics, Facebook Ads, Instagram Insights, and more, however, it is less comprehensive than Supermetrics. It works well for people who value simplicity over a wide variety of integrations.

Data Destinations
A wide variety of data destination choices are available from Supermetrics. Through APIs, you can easily transmit data to about 15 well-known applications like Google Sheets, Excel, Tableau, PowerBI, Looker Studio, and several data warehouses. Supermetrics gives you the ability to handle your data effectively if you need full reporting and data warehousing and are working with many data sources.

Whatagraph allows integration with 5+ applications, including BigQuery, Google Sheets, custom APIs, and more. It hands you complete control over your data so you can manage it efficiently.

Reporting and Visualization
Supermetrics is the go-to option for marketers who demand comprehensive, customized reports and in-depth research since it excels at data extraction and compilation. Supermetrics is a solid candidate if you want complete control over how your data is displayed and examined.

WhatAGraph is an expert in producing stunning, automatic reports. Because of its emphasis on design and visualization, marketers can create visually beautiful reports with less time and effort. If you need considerable adjustments, it may not be the best solution.

Pricing
Supermetrics comes with a 14-day free trial whereas Whatgraph offers a 7-day free trial. However, both tools provide users with subscription plans of distinct natures. Supermetrics offers plans based on the type of destination you pick.


Pricing is available for a few applications only, including Looker Studio, monday.com, Google Sheets, and Microsoft Excel. To get more information about other sources, you will need to get in touch with the sales team.
While Whatagraph offers straightforward subscription plans. It offers three plans, namely; Professional, Premium, and Custom. Starting from $199 a month with 25 data sources, it goes up to 100+ sources for customized pricing.

Usability
Supermetrics is generally user-friendly, however, certain integrations may need some technical expertise to retrieve data efficiently. For marketers who like an entirely no-code solution, this can be a disadvantage.
When it comes to usability, WhatAGraph excels, offering a straightforward and easy interface for creating visually stunning reports. For those who wish to shorten the reporting process without becoming mired down in technical minutiae, this makes it a terrific option.
Keeping the usability and functions aside, if these tools seem impossible for you to get a hold of due to technological restraints, keep reading—we’ve something in store for you.
Another Alternative for Your Marketing Reports: Catchr.io
While WhatAGraph and Supermetrics are both effective tools, there is a third option you need to take into account: Catchr.io.
Catchr.io provides a special combination of features that may improve the effectiveness and ease of use of your marketing reports. It is the best marketing analysis tool on the market today.
For more information, visit Catchr.
A Quick Overview: Why Catchr Stands Out
Catchr.io makes a strong case for marketers and data-driven teams looking to centralize and automate their reporting. Beyond its strong feature set, what really differentiates Catchr is how it combines simplicity with scalability—so you can start small and expand as your data needs grow. Here are the key highlights:
No Coding Required
Catchr.io is designed to be fully no-code, making it accessible even for teams without technical resources. Unlike solutions that require SQL skills, custom queries, or complex setup, Catchr lets you connect platforms, pull the right data, and push it into your reporting tools with just a few clicks. Whether you’re using Looker Studio, Google Sheets, or Power BI, you can build and refresh dashboards without writing a single line of code. This approach removes friction for marketers and saves valuable time.
Simple Account Setup
Getting started on Catchr is fast and frictionless. You don’t need to go through a long sales cycle to activate your account. Since it’s a self-serve platform, you can sign up instantly, connect your first platforms, and start sending data to your reporting tools right away. This streamlined onboarding ensures teams can start extracting value quickly, without delays or technical bottlenecks.
Pricing Built for Growth (Not Just for Budget)
Catchr’s pricing is transparent and designed around real usage needs, with four plans: Starter, Growth, Scale, and Custom, starting from $20/month. Instead of forcing teams into complex pricing based on destinations or hidden add-ons, Catchr adapts to your data volume and reporting requirements over time.
As you grow, you can scale by adding more platforms, more accounts, accelerated data, and higher levels of support, with advanced features like API access available in Growth and Scale. This makes Catchr not only a cost-effective option, but also a long-term solution that supports teams at every stage—from startups and small marketing teams to large agencies and enterprise reporting setups.
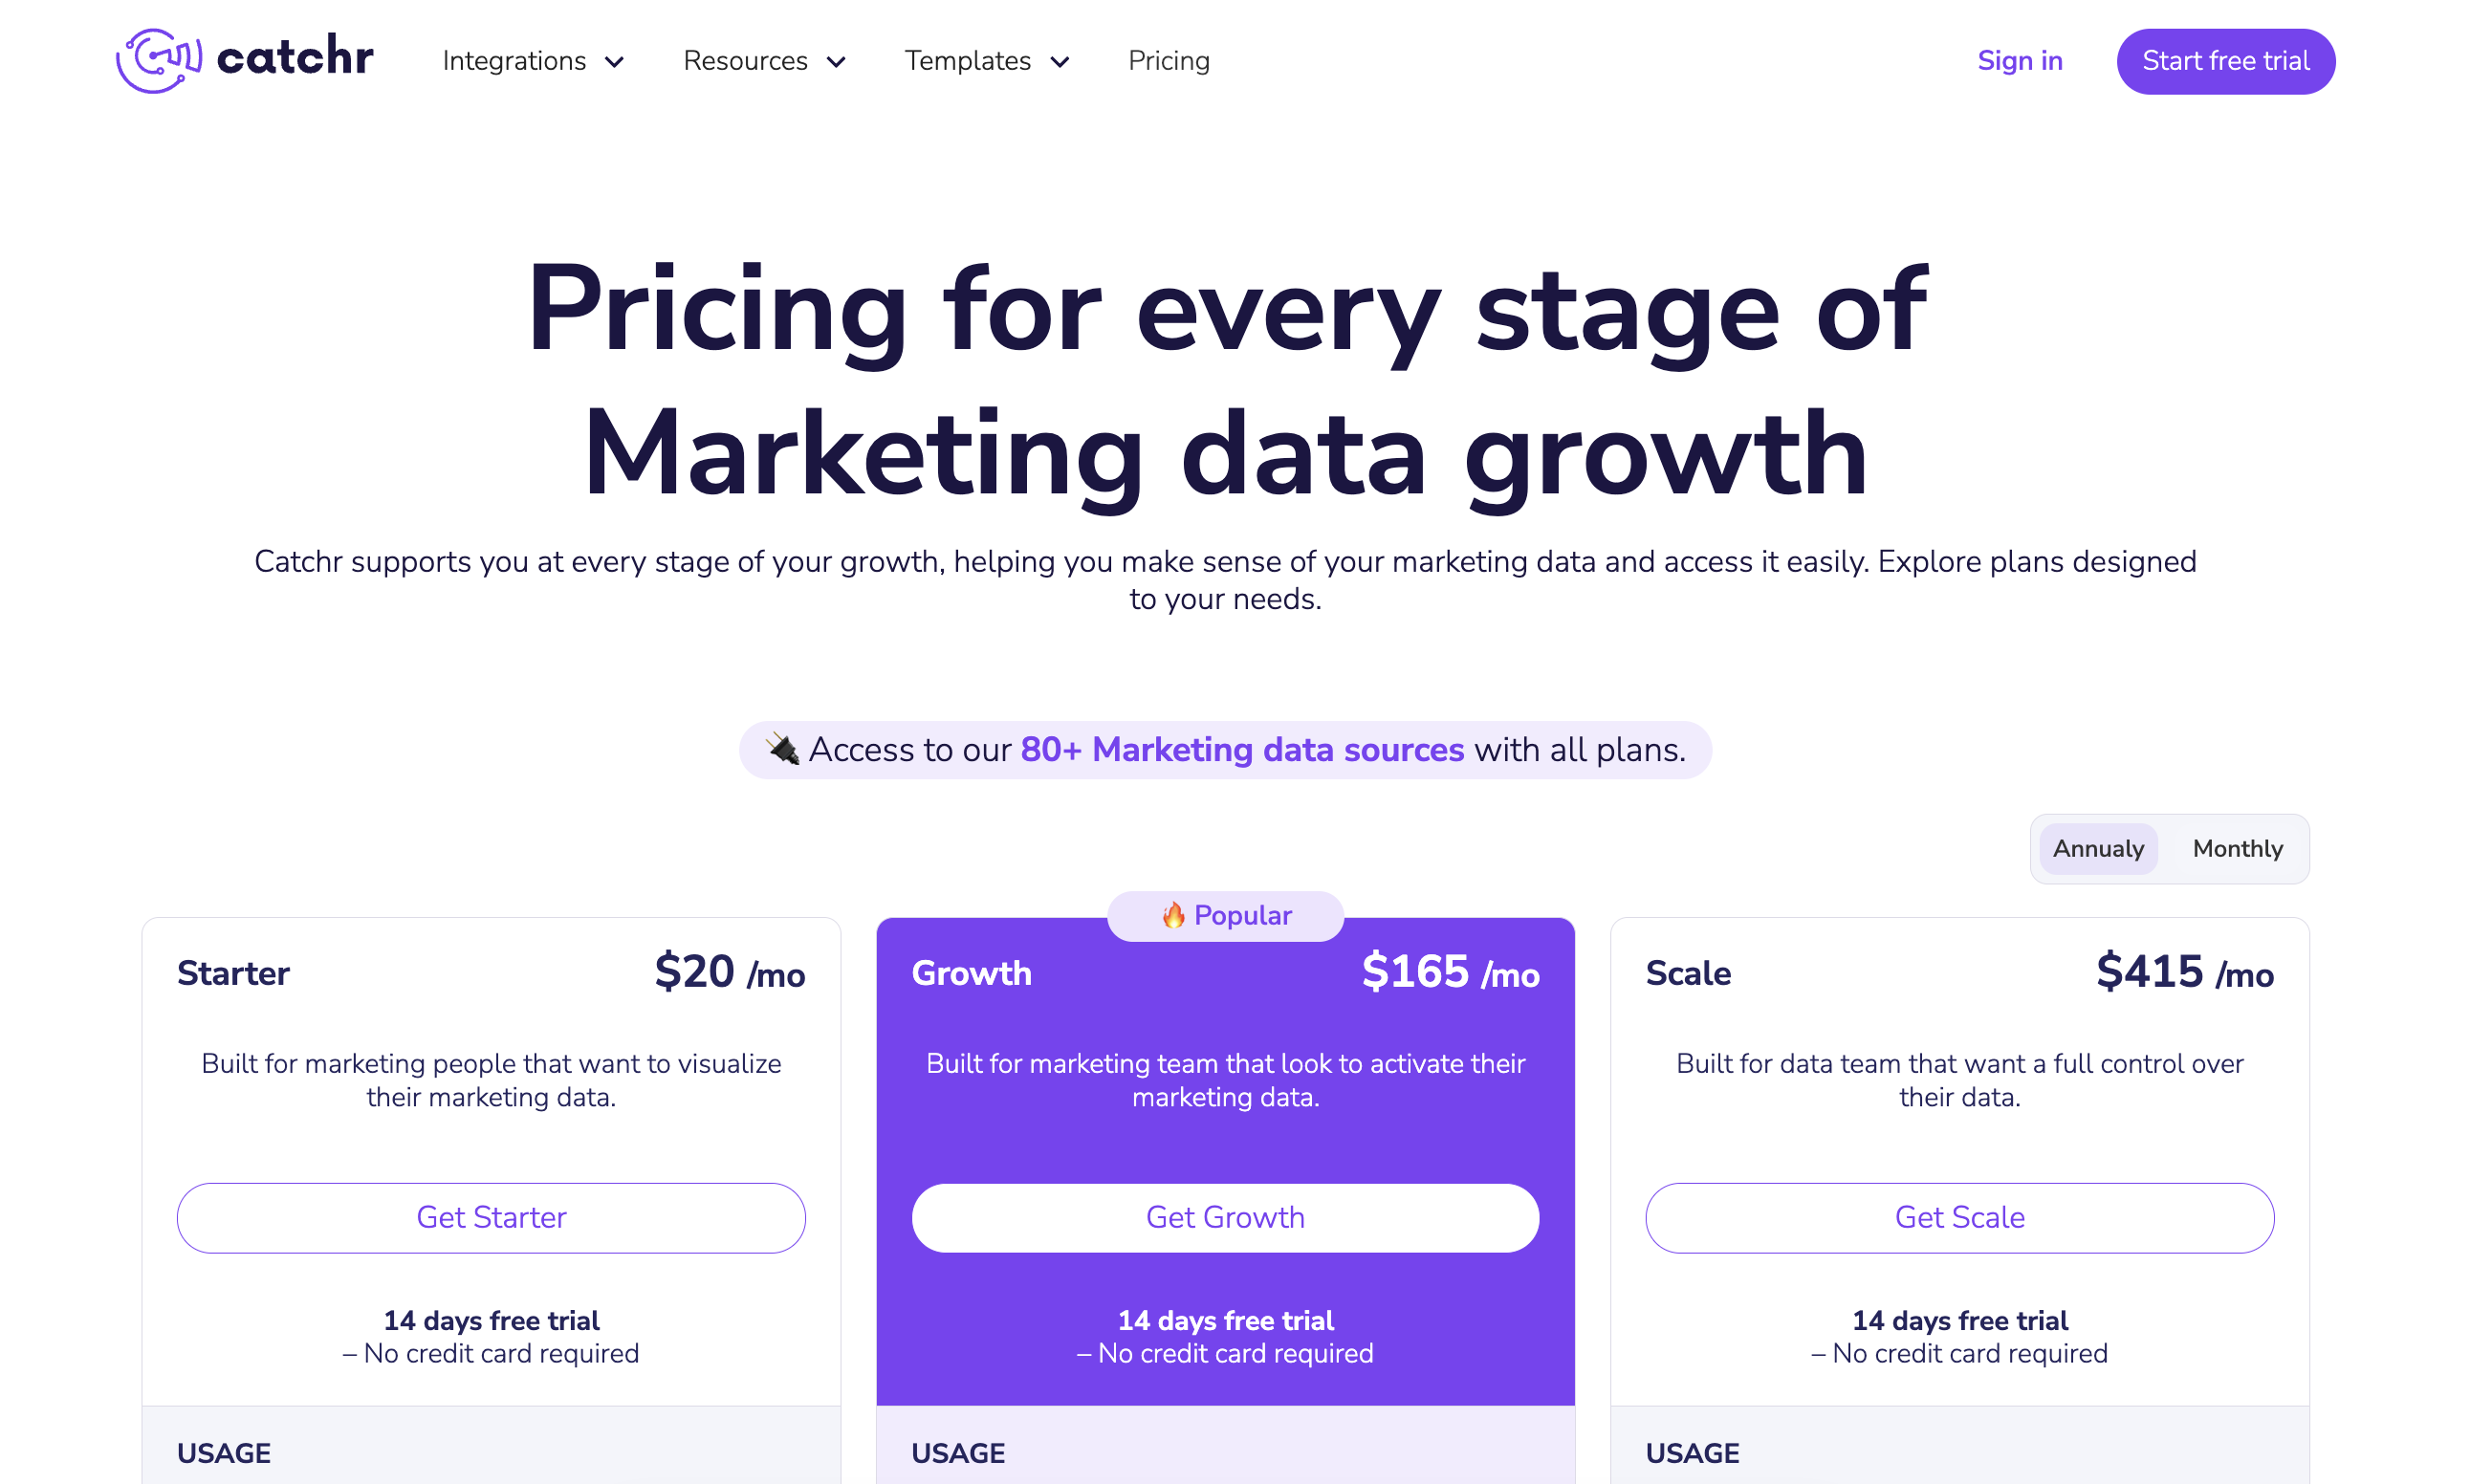
Starting from $20/month for freelancers and small teams and scaling up through Growth ($165/month), Scale ($415/month), and a Custom plan for advanced needs, Catchr offers versatile pricing that adapts to every stage of growth—from beginners to agencies and enterprise organizations.
High-Functionality and User-friendliness
Catchr.io successfully balances high functionality and usability. Users may quickly get used to the platform because of its user interface's simplicity and straightforward design. You will find Catchr.io to be approachable and friendly, regardless of your level of marketing expertise or experience with data research.
Catchr.io doesn't sacrifice functionality while doing so. It has several features that may be tailored to the various requirements of marketers, from small firms to major corporations. The platform is a complete solution for marketing analysis since it excels at data extraction, processing, and reporting.
Integrations
Catchr.io understands how essential it is to connect all your marketing and business data in one place. Like Supermetrics, Catchr offers seamless integrations with the tools teams rely on most—covering 80+ data sources and supporting 20 destinations, including Looker Studio, Google Sheets, Power BI, and major data warehouses and storage solutions.
This wide connector coverage makes it easy to centralize data from multiple platforms and build unified reporting across channels. Whether you’re a freelancer managing a few key accounts or an agency handling complex multi-platform reporting, Catchr adapts to your stack and scales with your needs, making it a flexible solution for teams that rely on diverse data sources to drive decisions.
Appropriate For
Catchr.io is well suited for a wide range of businesses and marketing profiles, thanks to its no-code approach and pricing structure that scales with data needs. It’s a strong fit for:
- Small and Medium-sized Businesses (SMBs): Catchr is a great option for SMBs that need reliable reporting without heavy technical setup. With the Starter plan, teams can start small and still benefit from a robust set of integrations and destinations.
- Startups: Catchr helps early-stage teams move fast. You can centralize your marketing data quickly, automate reporting, and scale up later as you add new platforms, accounts, or reporting requirements—without switching tools.
- Freelancers and Independent Marketers: Catchr is ideal for solo users who want professional dashboards without a steep learning curve. The no-code setup makes it easy to connect sources and deliver client-ready reporting in Looker Studio, Google Sheets, or Power BI.
- Agencies: As agencies expand their client base, their reporting needs grow rapidly. Catchr supports that evolution with Growth and Scale plans, offering more platforms, more accounts, accelerated data, and additional capabilities like API access—so agencies can handle high-volume reporting efficiently.
- Mid-sized Organizations: Catchr offers a strong balance of ease of use and scalability for teams that manage multiple channels and stakeholders. It’s a practical choice for companies that want full reporting capabilities while keeping setup and maintenance simple.
- Large Enterprises: Catchr can support complex reporting environments through higher tiers and a Custom plan, with advanced options for larger data volumes, multi-platform setups, and tailored support—making it suitable for organizations with enterprise-level requirements.
In short, Catchr.io is increasingly becoming a go-to option in the marketing analytics space because it combines ease of use, strong integrations, and scalable plans that evolve with your needs. Whether you’re a freelancer building dashboards for clients or a large team managing high-volume reporting, Catchr provides the tools to unlock the full value of your marketing data—without technical complexity.
Final Thoughts
All in all, the decision between Supermetrics, WhatAGraph, and Catchr.io relies on your own requirements and preferences. For individuals who demand wide data sources and thorough research, Supermetrics is a reliable option. For individuals who value visually attractive, automated reporting, WhatAGraph stands out as a great option. Catchr.io fills the void by providing a no-code, affordable substitute with many connectors and lovely reporting tools.
Having the appropriate tools is crucial for the success of your efforts in the area of marketing analytics. When making a choice, take into account your priorities, your spending plan, and the type of reporting requirements. Your marketing efforts might be considerably impacted by the tool you use since each of these tools has certain advantages.