Blog post
KPI

When you feel under the weather, you head to the doctor to see what is wrong. After reading some outdated magazines and discussing the situation, the physician performs an examination to gauge what your symptoms mean, if anything.
Social media KPIs allow you to create a diagnosis for your brand, like that doctor determining what is wrong with you when feeling sick.
Knowing metrics like engagement rate, follower count, and customer lifetime value helps you understand how well you connect with your audience.
The best key performance indicators depend on your brand’s specific goals. Every business is different, so some might want to include all the following KPIs when focusing on growth, while others might choose a combination of them.
In either case, these are the primary data points to review in your social media digital marketing report.
This key performance indicator is one of the go-to information points for understanding how your social media resonates with a target audience. It measures interactions with your content as a percentage of reach or impressions.
Engagement Rate (%) = Interactions / Impressions *100
or
Engagement Rate (%) = Interactions / Reach *100
This KPI is crucial as it highlights the level of interest your audience has in your content. A high engagement rate is important to ensure your post or video has a real impact. The more engaged your community is, the more your brand awareness will grow.
A good engagement rate on social media depends on the platform, industry, type of content and audience size. As a general guide:
The larger your audience, the lower your engagement rate tends to be. Smaller accounts may see 10%+ engagement, which is much harder to maintain with over 100k followers.
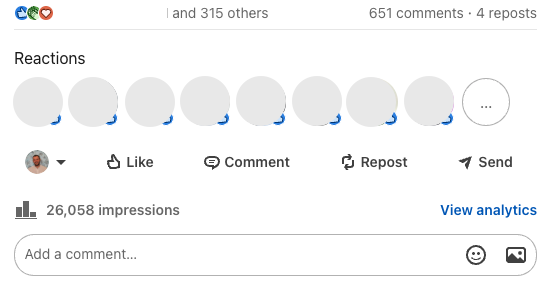
For example, in the previous screenshot, the engagement rate can be calculated as follows:
Engagement Rate = (315 + 651 + 4) / 26,058 × 100 = 3.72%. This is considered an excellent engagement rate on LinkedIn.
For this KPI, you have two data points to review.
Reach is the number of unique users who see your post. If one person sees a post three times, they still count as one.
Impressions will measure the total number of times your post has been displayed on someone's screen, regardless of clicks. If that same person sees a post three times, that counts as three impressions.
These metrics give you an idea of brand visibility. More reach and impressions often mean more awareness. However, a high reach with low engagement might indicate that your content is widely seen but needs to be more compelling to earn a click (or interactions).
High-quality content drives more shares and views. But remember: reach and impressions are just the starting point — not guarantees of engagement or conversion.
Looking at this social media KPI lets you see how fast your audience expands or contracts. It puts your momentum into a measurable metric.
Follower Growth Rate (%) = (New Followers / Follower count previous period) × 100
with New Followers = Current Follower Count − Follower Count from Previous Period
If you start with 2,000 followers and gain 200, your growth rate would be 10%.
Growing your follower count expands your reach and builds credibility, strengthening your digital marketing impact. A rising number often reflects growing brand awareness, while stagnation may signal the need for action.
To boost growth, post regularly, create high-value content, collaborate with partners or influencers, and engage with your audience. But remember: follower quality matters as much as quantity — focus on attracting people genuinely interested in your brand to ensure meaningful results.
Being active on social media isn’t just about brand awareness — it’s also about reaching your target audience and driving action, such as signing up for a newsletter, purchasing a subscription, or buying a product or service.
That’s why the conversion rate is a key metric: it shows how effectively your social content contributes to business outcomes. A high conversion rate often means your strategy is reaching the right people and encouraging meaningful engagement.
Conversion Rate (%) = (Number of Conversions / Total Number of Visitors) × 100
However, keep in mind:
Catchr helps you track and analyze your Social media performance from Facebook, Instagram, LinkedIn and more social media platform, and goes even further by integrating with tools like Google Analytics 4, Shopify, and more. These connectors allow you to centralize all your marketing data in your preferred platform — whether it’s a dashboard tool like Looker Studio or a database — making your analysis more accurate, real-time, and less time-consuming. That way, you can focus less on reporting and more on strategy.
CTR shows the percentage of people who clicked on an ad, website link, or any call-to-action after seeing it on your social media accounts.
CTR (%) = (Number of Clicks / Number of Impressions or Reach) × 100
Imagine you've got an ad that's been shown 2,000 times, and it got clicked on 100 times. Your click-through rate would be 5%.
Higher figures in your digital marketing report indicate your content or advertising resonates with the targeted audience. If it is low, it might be time to rethink your message or change your targeting strategy.
This KPI is a mix of understanding your audience and having high-quality content that engages the customer. With continual testing and adjustment, you can see revenues rise when it becomes a point of emphasis within your digital marketing efforts.
Video content plays a key role in capturing attention and delivering messages quickly. But beyond views, it’s important to understand if people actually watch your videos all the way through. A high completion rate means your video is engaging, well-structured, and relevant.
Completion Rate (%) = (Number of Completed Views / Total Video Views) × 100
Keep in mind: not all views are equal. Focus on completion rate to assess true engagement. If drop-offs happen early, consider adjusting the hook, length, or content flow.
Share rate indicates how often your content is being shared by users with their own networks. It's a powerful signal of content quality and relevance — shared posts expand your reach without additional spend.
Share Rate (%) = (Number of Shares / Total Impressions or Views) × 100
Highly shareable content usually informs, entertains, or emotionally resonates. Optimizing for share rate helps grow organic reach and community visibility.
Cost per result measures how much you're spending for each desired action in your campaign, such as a click, form submission, or purchase. It's a crucial metric for evaluating the efficiency of your ad spend.
Cost per Result = Total Campaign Spend / Number of Results
A lower cost per result generally indicates that your targeting, creative, and funnel are working well. Optimizing this KPI helps you allocate your budget more effectively and achieve better ROI on paid social campaigns.
Analyzing your top performing posts allows you to identify what formats, topics, and messages generate the most engagement or conversions. There is no fixed formula, but key metrics like engagement rate, CTR, and conversion rate can help rank your content.
Understanding what works best lets you replicate success and refine your content strategy based on real audience behavior, rather than assumptions or guesswork.
Social Media Return on Investment (ROI) shows how much business value your social media efforts generate in relation to the cost invested. It’s one of the most strategic KPIs for justifying and optimizing your marketing activities.
Social Media ROI (%) = [(Revenue from Social – Cost of Social Media Activities) / Cost] × 100
Tracking ROI helps you determine which platforms, campaigns, or formats contribute most to your business objectives — whether it's revenue, lead generation, or customer retention.
Optimizing your social media starts with consistent tracking of key KPIs like engagement, reach, and conversions. Catchr makes it easy by centralizing all your data into a dashboard, spreadsheet, or database — always up-to-date, always accessible. You can start connecting your data now to save time on reporting and focus on what really matters: growing your strategy with clear, actionable insights.
Move your Marketing data to your favorite tools
Simplify your data extraction and move all your Marketing data to dashboard tools, spreadsheets, database and more... No code required!
75+ connectors | 20+ destinations
✔ 14 days free trial — No credit-card required


