Blog post
KPI

A successful SEO strategy is never static—it must continuously adapt to evolving search engine algorithms, emerging technologies like AI, and shifting user expectations. To steer this evolution effectively, tracking the right KPIs is essential. In this article, we explore the core performance indicators every business should monitor to strengthen its SEO efforts, while keeping in mind that some metrics may gain relevance depending on specific contexts such as industry, company size, or market focus.
In this article, you’ll discover the key SEO KPIs to track, where to access them, and a few free reporting examples to help you get started. The goal: help you focus on what really matters and make data-driven SEO decisions.
In the following sections, we’ll walk through 14 essential SEO KPIs, grouped into four strategic categories:
These categories follow the natural flow of an SEO journey—from being found to converting visitors—while integrating the key factors that influence performance at each stage.
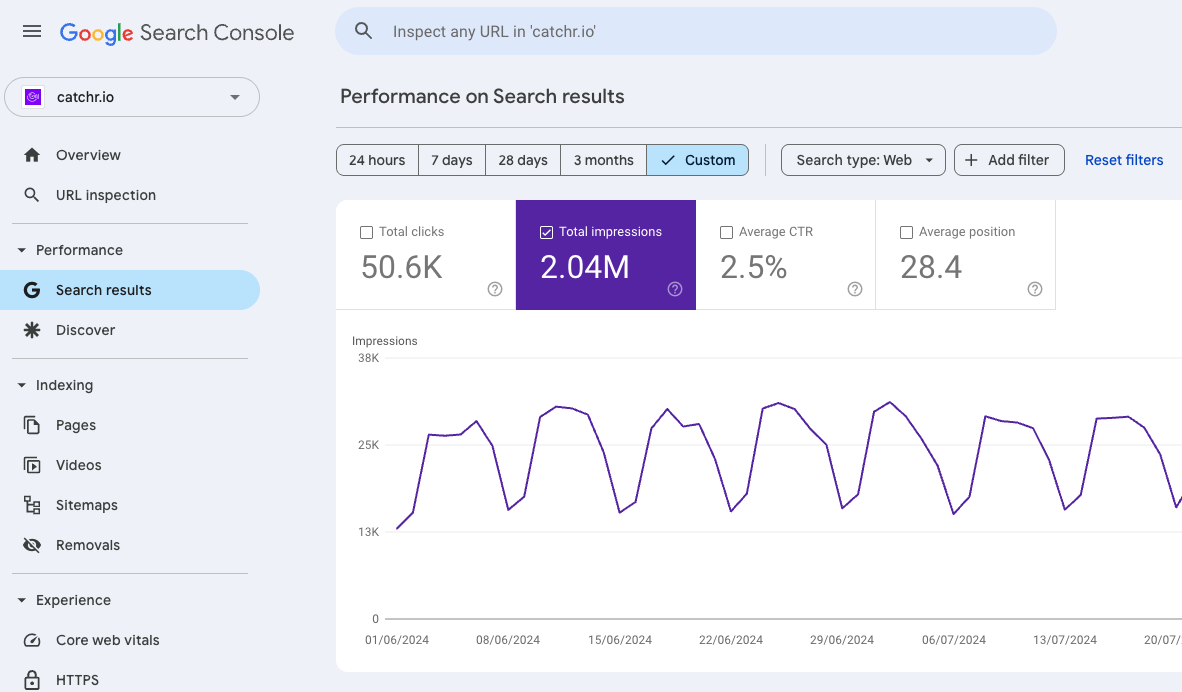
Impressions represent the number of times a page from your site appears in users' search results, regardless of whether they click. This KPI gives you an early signal of visibility and search engine exposure.
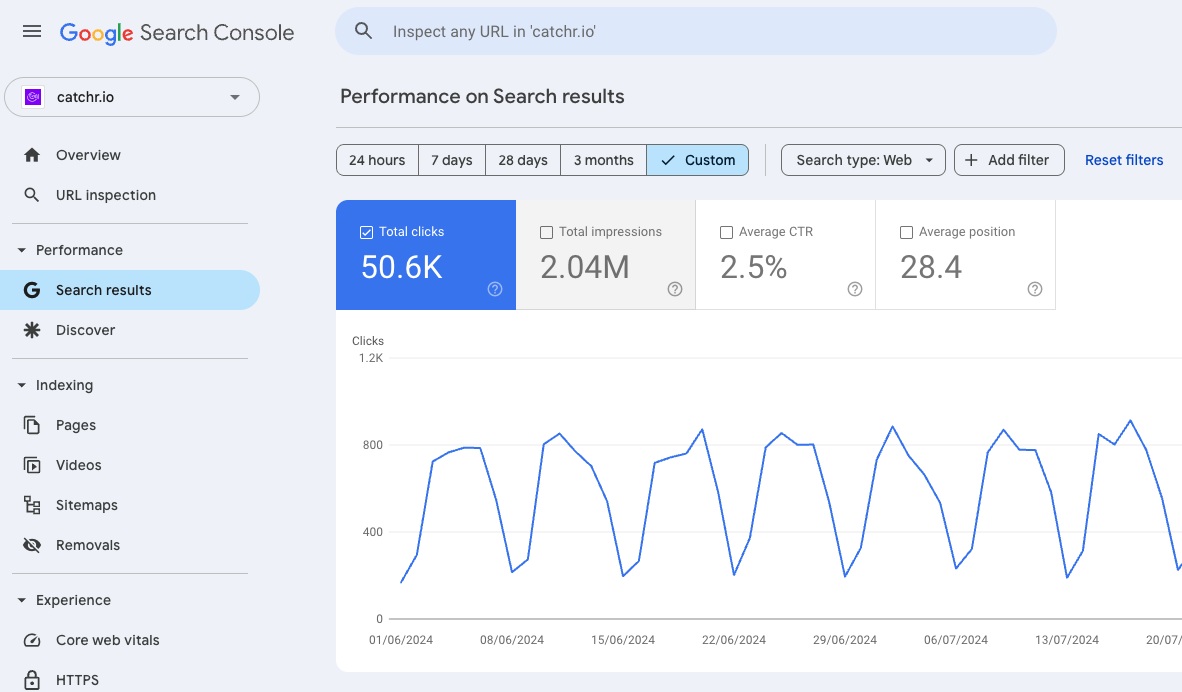
Clicks measure how often users choose your content in search results. It's a direct indicator of interest and relevance, showing whether your title and meta description resonate with search intent. An increase in clicks typically means better alignment between your content and user needs.
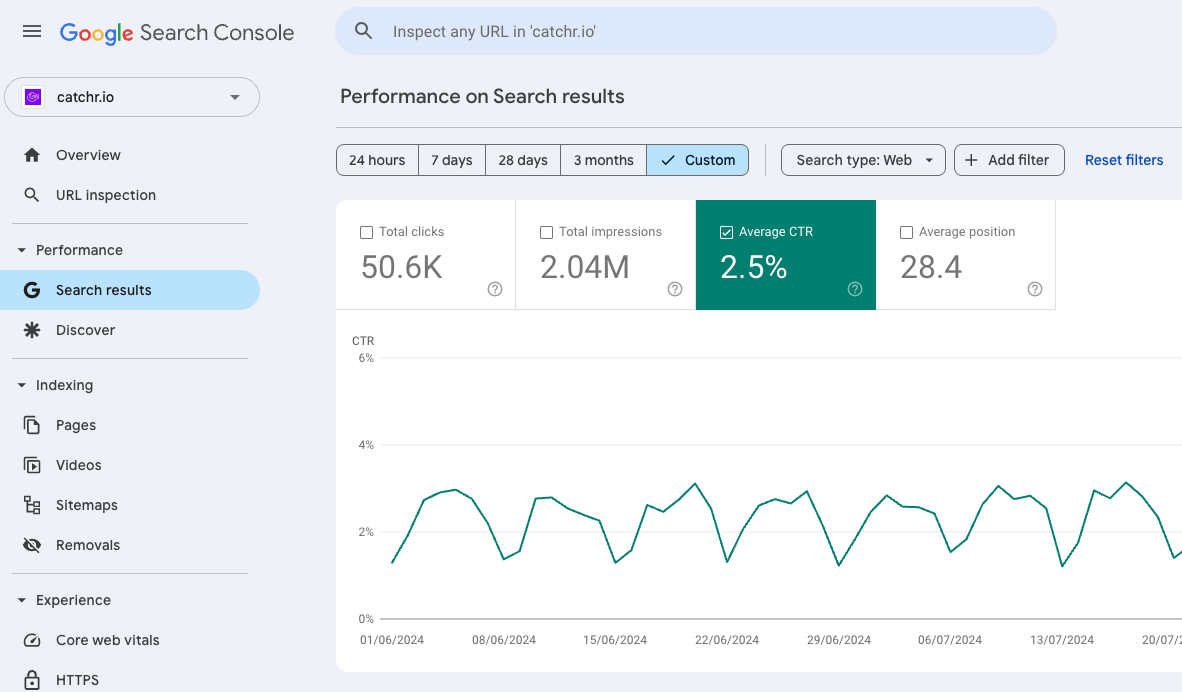
Click-Through Rate is the ratio of clicks to impressions. It reflects how compelling and relevant your search snippets are. A strong CTR often signals that your content is competitive in SERPs, even if you're not ranking first.
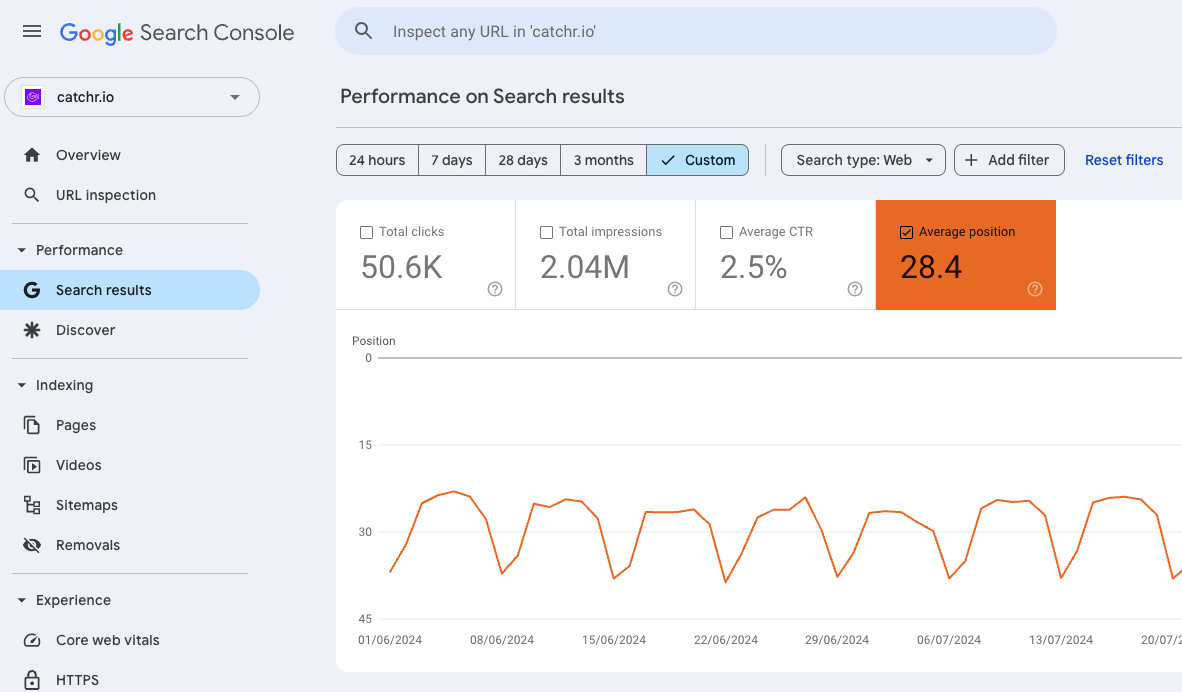
Position refers to the average ranking of a URL for a specific query. It helps you understand your visibility level and how it compares to competitors. The closer to position 1, the more likely your content is to be clicked and drive traffic.
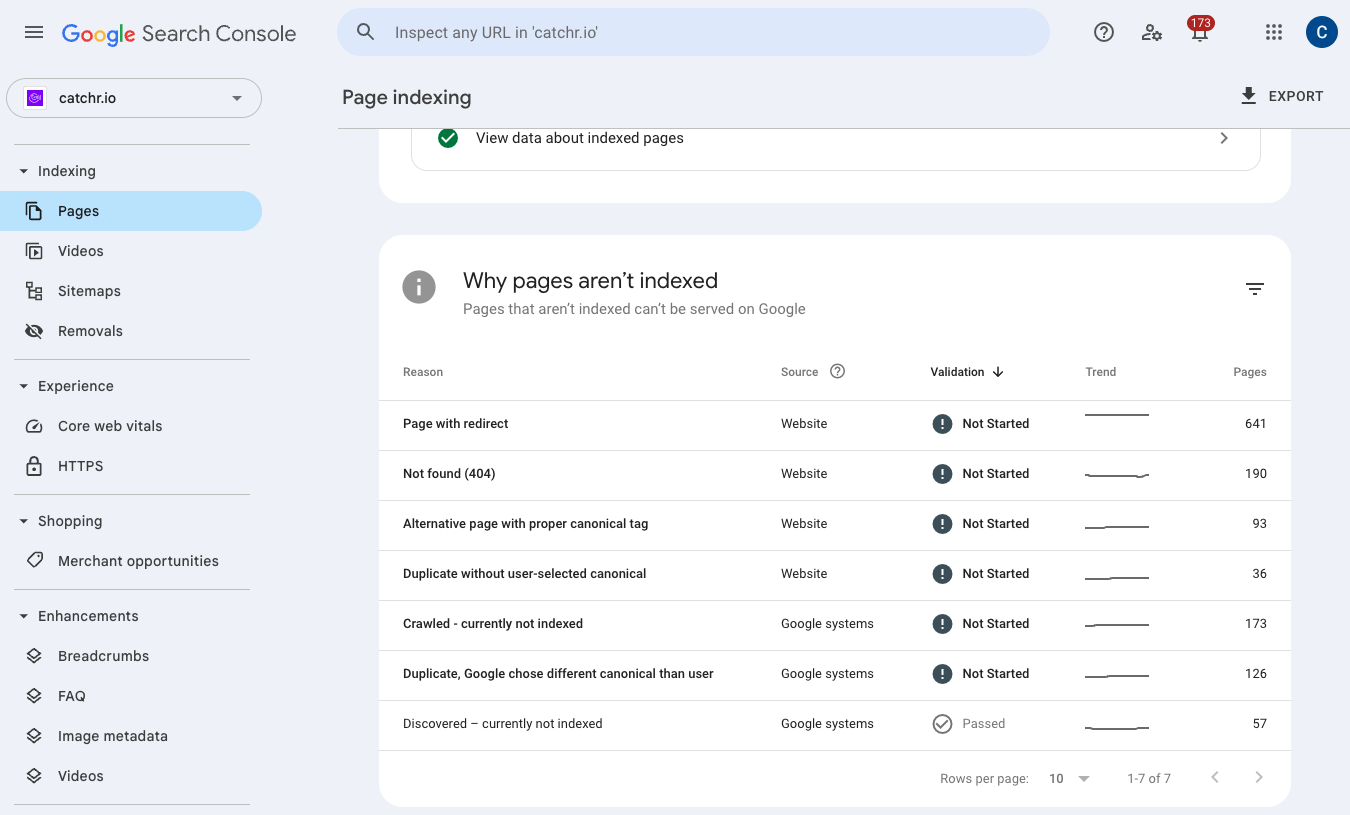
4xx errors (like 404 - page not found) occur when a page is requested but cannot be found. They can harm user experience and block search engines from crawling your site properly. Monitoring them ensures your site remains healthy, navigable, and SEO-friendly.
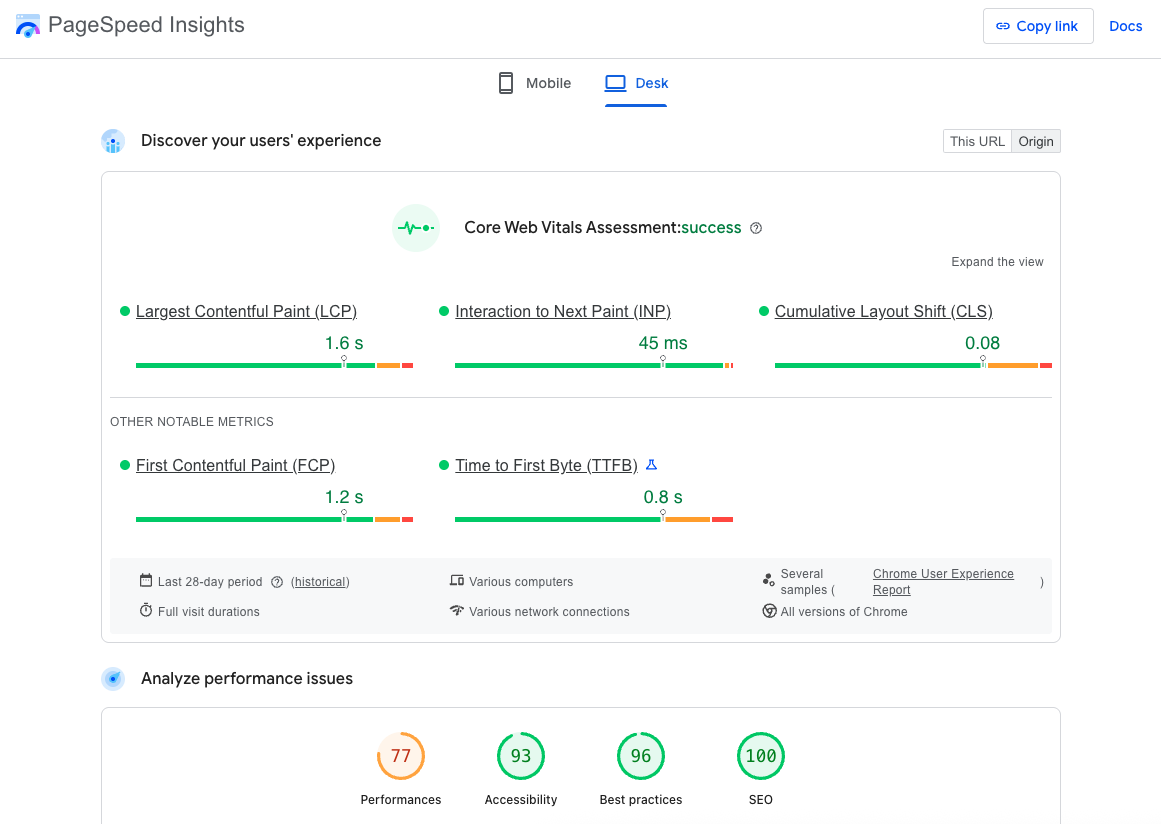
Core Web Vitals are Google’s performance signals measuring loading speed (LCP), and visual stability (CLS). They directly affect user experience and are officially part of Google’s ranking criteria. Poor scores can reduce both rankings and conversions.
DA (Moz) or DR (Ahrefs) is a proprietary score estimating your website’s authority based on the quality and volume of backlinks. While not a direct ranking factor, it strongly correlates with your ability to rank competitively.
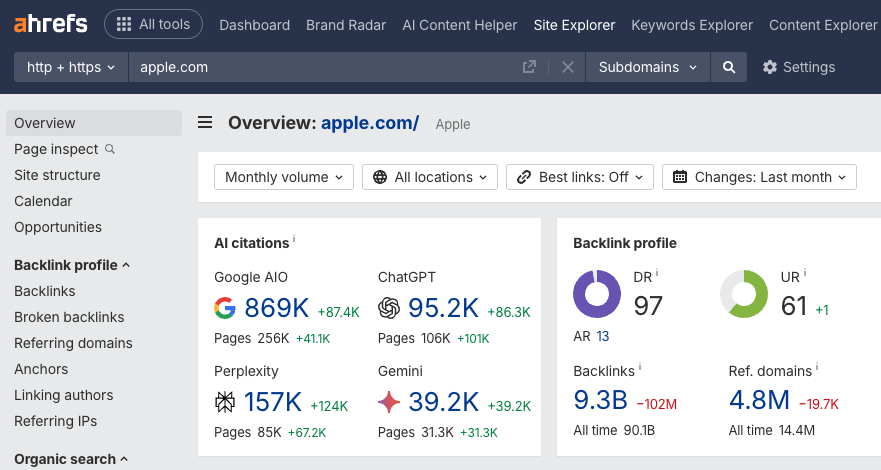
This KPI measures both the quantity of referring domains and the authority or relevance of those links. Backlinks are one of the most impactful SEO signals—they indicate trust, authority, and help pages rank better.
A session is a set of user interactions with your website within a single visit. It reflects the volume of traffic your SEO is driving. Tracking sessions helps you assess the reach and scalability of your organic strategy.
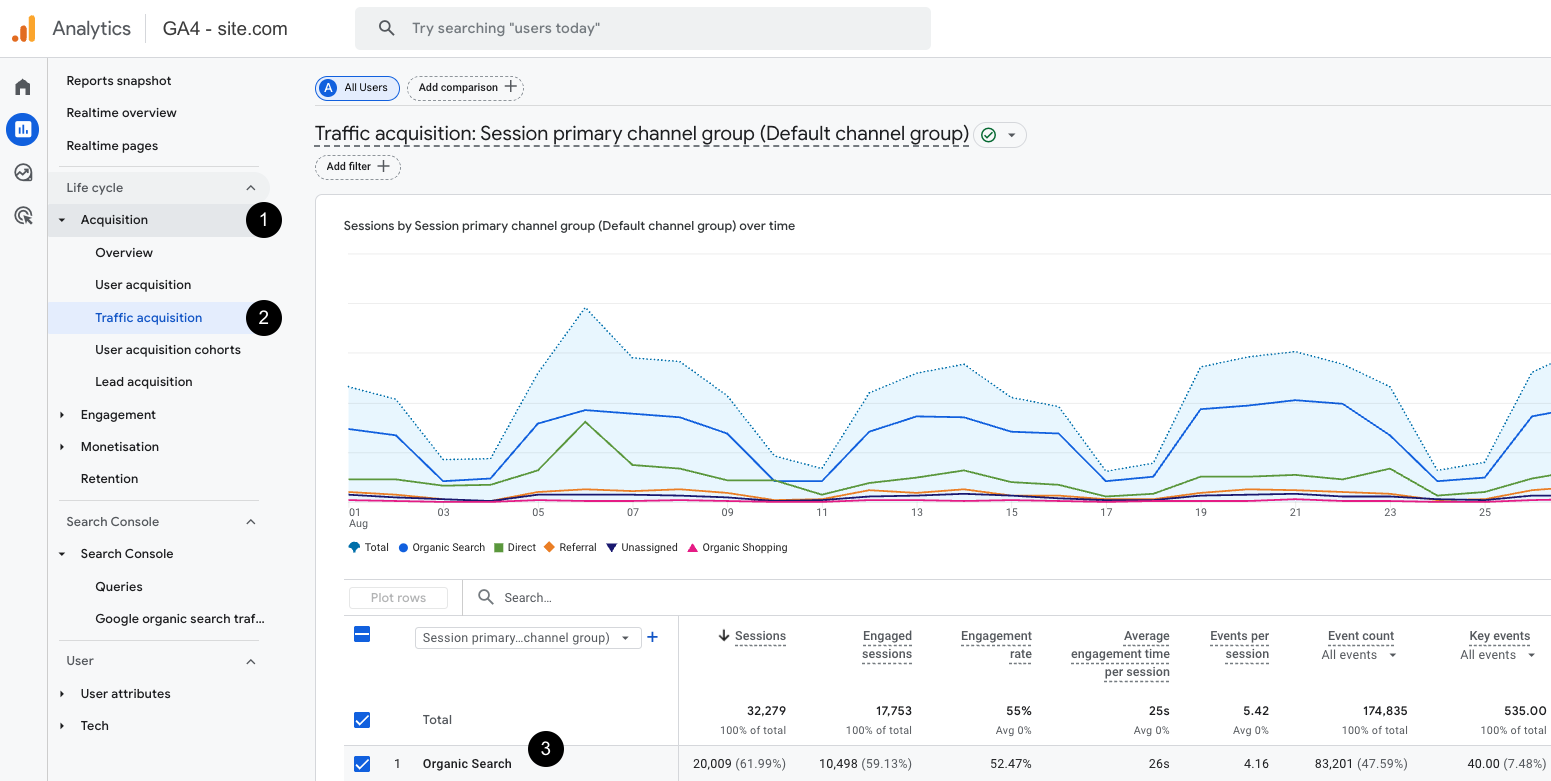
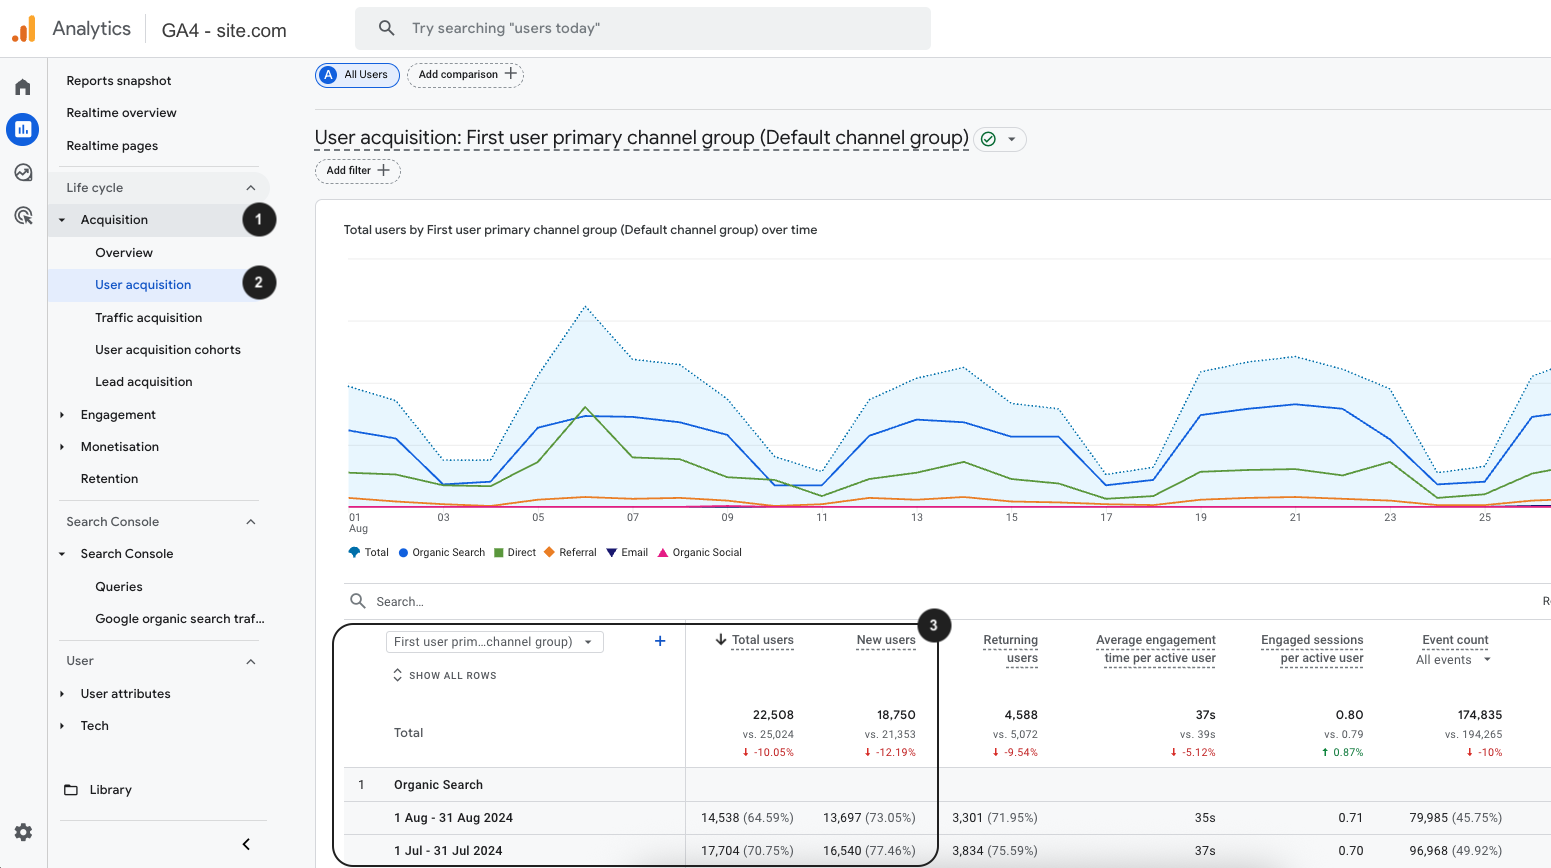
New users are first-time visitors to your site. This KPI shows how effective your SEO is at reaching fresh audiences and expanding your visibility. High new user rates can signal strong discoverability and top-of-funnel performance.
Engagement rate measures how many sessions included meaningful interactions, like clicks, scrolls, or conversions. It reflects how relevant and engaging your content is to users coming from search. A high engagement rate means users are interacting with your site, while a low one may signal content mismatch or usability issues.
Session duration is the average length of a user visit. Longer sessions generally suggest higher content value or user interest. However, it should be contextualized—high duration without conversion might indicate friction.
Conversion volume is the total number of desired actions (like purchases, signups, or form submissions) from organic traffic. It directly connects SEO performance with business value and helps justify ROI.
Conversion rate is the percentage of visitors who complete a conversion. It measures the efficiency of your SEO efforts in driving meaningful results—not just traffic, but value.
Measuring SEO performance goes far beyond tracking rankings or traffic alone. By focusing on a combination of visibility, technical health, user engagement, and conversion KPIs, you gain a comprehensive view of what’s working—and where to improve. These 14 indicators provide a solid foundation for monitoring your SEO strategy, aligning efforts across teams, and demonstrating tangible results to stakeholders.
To simplify and centralize this data, tools like Catchr can help you connect sources such as Google Analytics and Search Console, and turn your KPIs into automated, visual reports.
Keep in mind that the relevance of each KPI can vary depending on your goals, industry, and business maturity. The most effective SEO reporting is not just data-rich—it’s insight-driven. Start with these core metrics, adapt them to your context, and use them as a compass to guide your SEO decisions in an ever-changing digital landscape.
Move your Marketing data to your favorite tools
Simplify your data extraction and move all your Marketing data to dashboard tools, spreadsheets, database and more... No code required!
75+ connectors | 20+ destinations
✔ 14 days free trial — No credit-card required


