Blog post
Catchr
Looker Studio
Tracking your Instagram performance is easier than ever with Looker Studio, where you can visualize your key metrics and monitor your account’s growth in real time. If you manage an Instagram account for your brand or clients, connecting it to Looker Studio allows you to track engagement, audience growth, and content performance.
There are two main ways to connect your Instagram data to Looker Studio:
Connecting your Instagram account to Looker Studio helps you analyze key social media metrics, monitor growth over time, and automate reporting. Instead of switching between the Instagram app, Meta Business Suite, and spreadsheets, you can visualize everything in one dynamic report.
With Looker Studio, you can:
In short, connecting Instagram to Looker Studio gives you a clear, real-time picture of your social media performance.
For most marketers and social media managers, the automated connection is the most efficient and scalable option. It uses the Instagram Graph API to pull your account and post insights directly into Looker Studio.
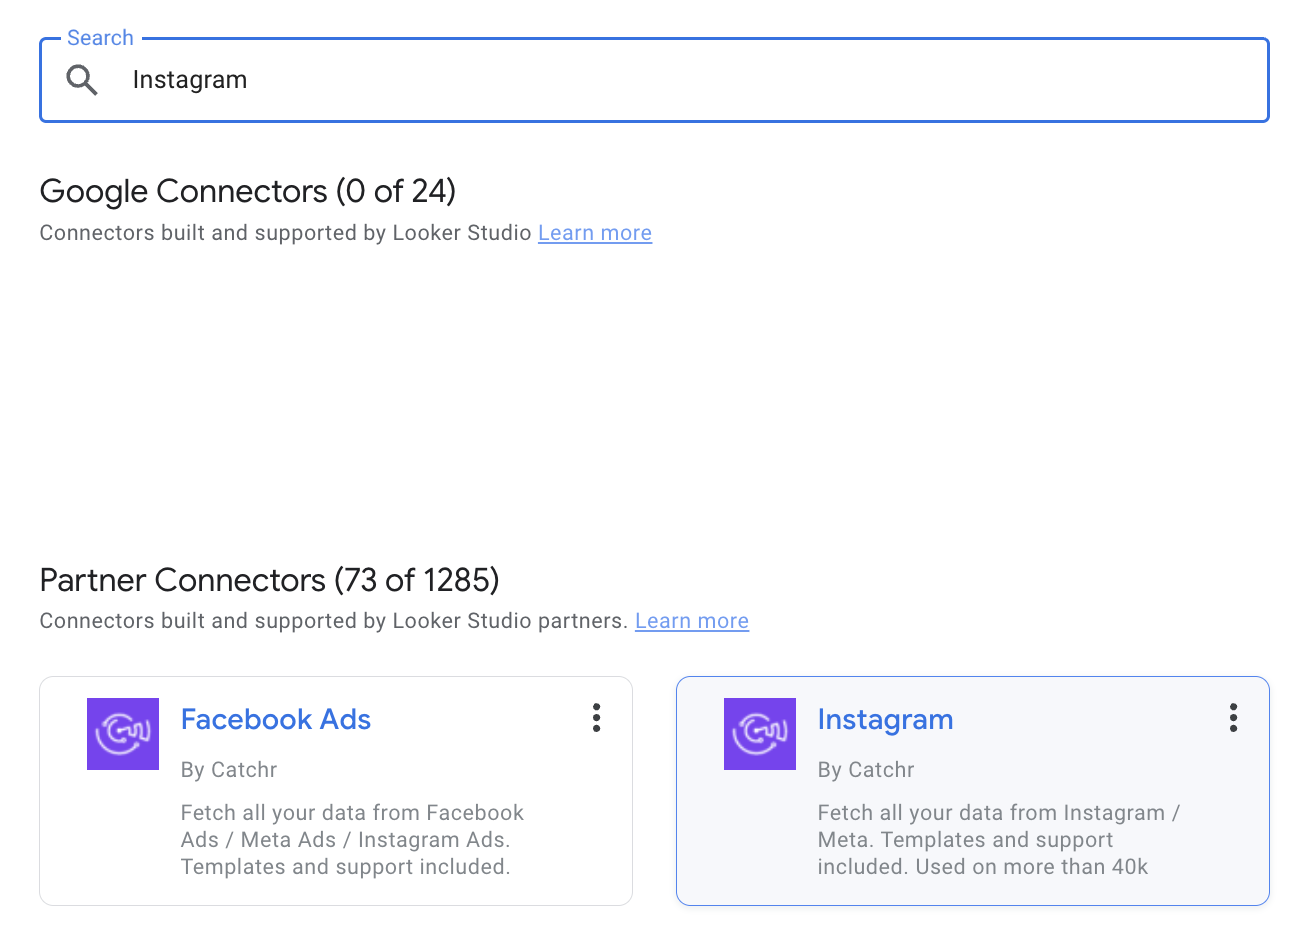
Partner connectors like Catchr act as a bridge between Instagram and Looker Studio.
Once authorized, Catchr connects to your professional Instagram account and automatically imports your profile and post performance data.
Your metrics and dimensions refresh daily, so your reports always reflect your latest engagement and audience data, no manual updates needed.


Connecting Instagram to Looker Studio allows you to track your performance in real time and build automated dashboards.
To help you get started faster, Catchr provides ready-to-use Looker Studio templates for Instagram.
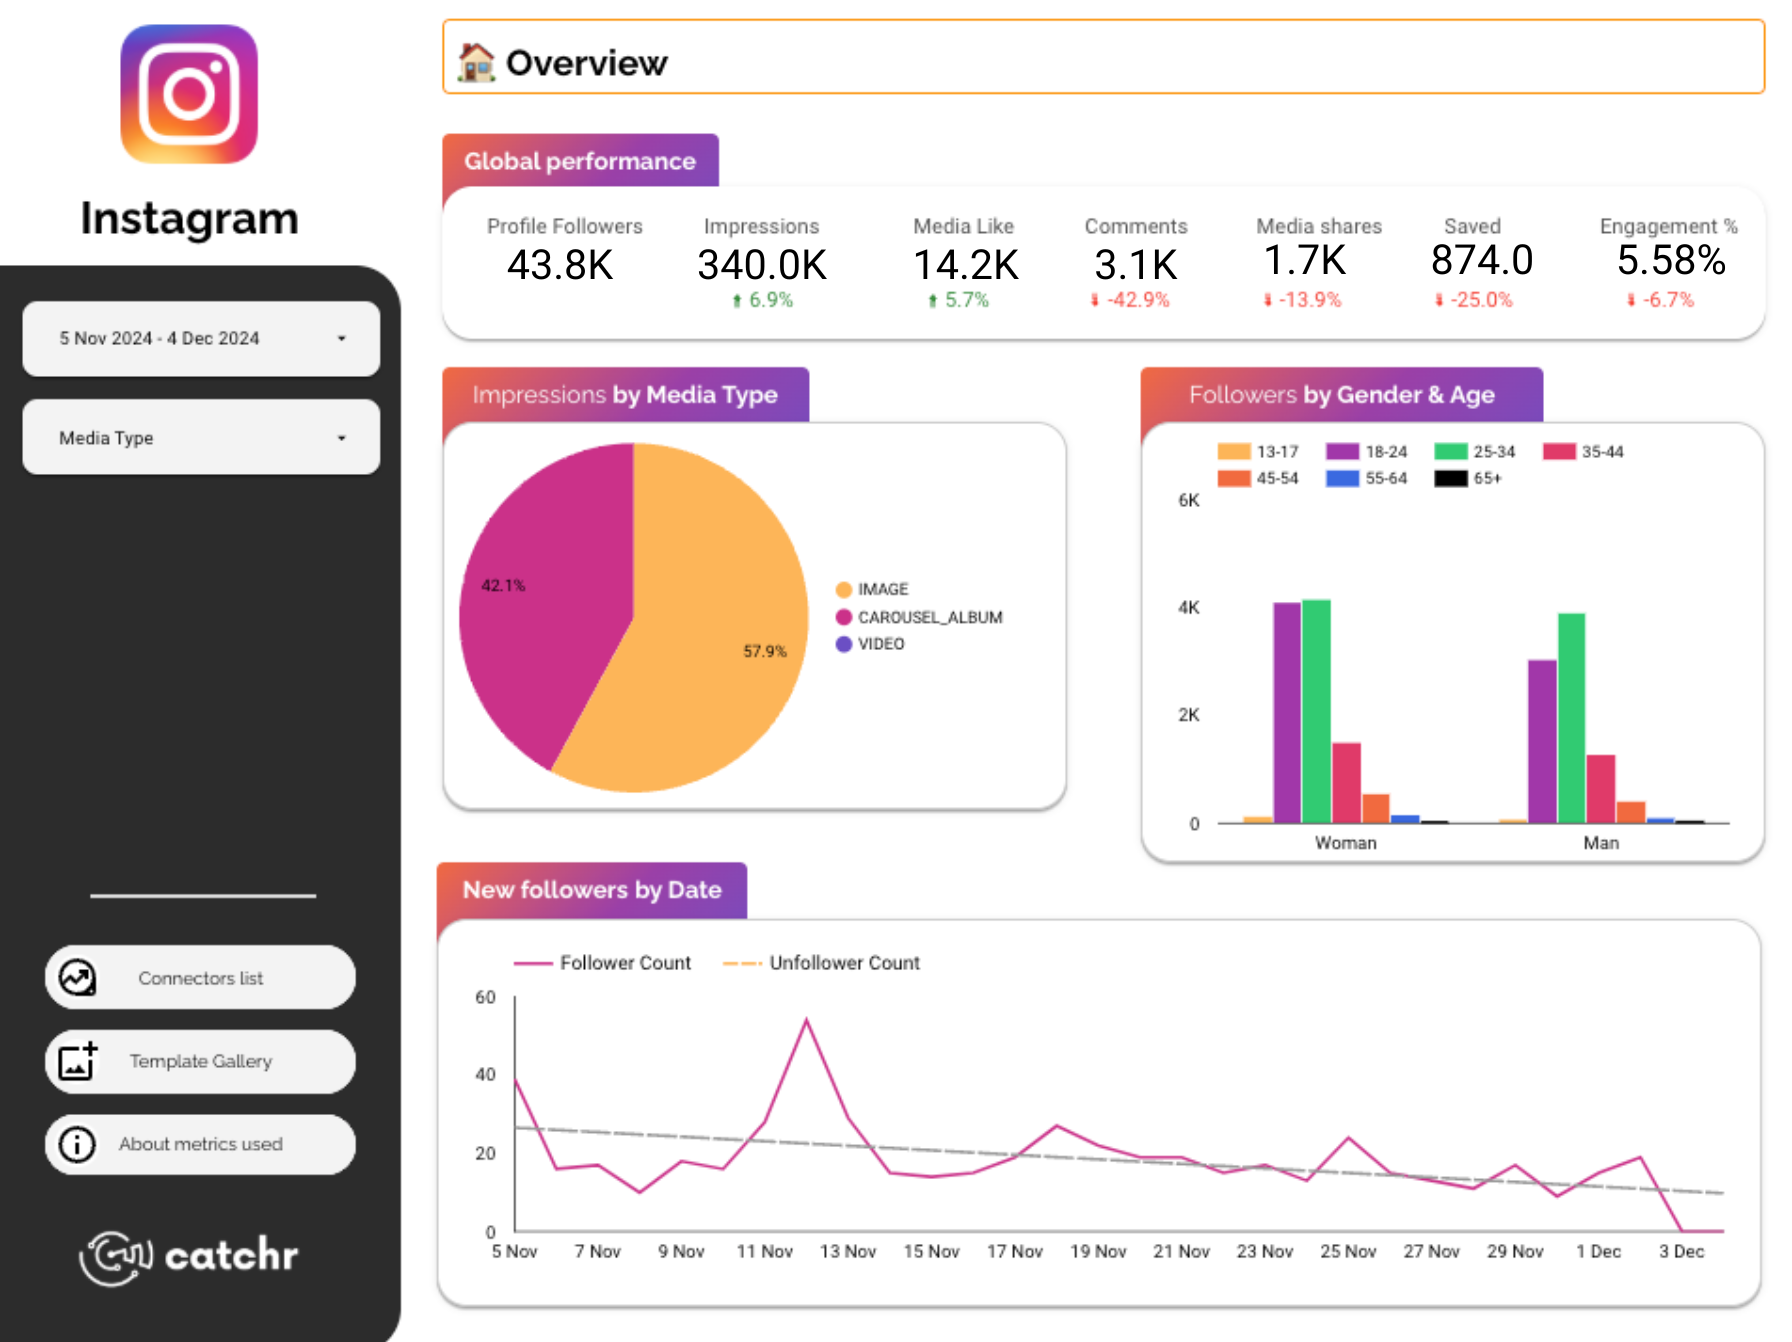
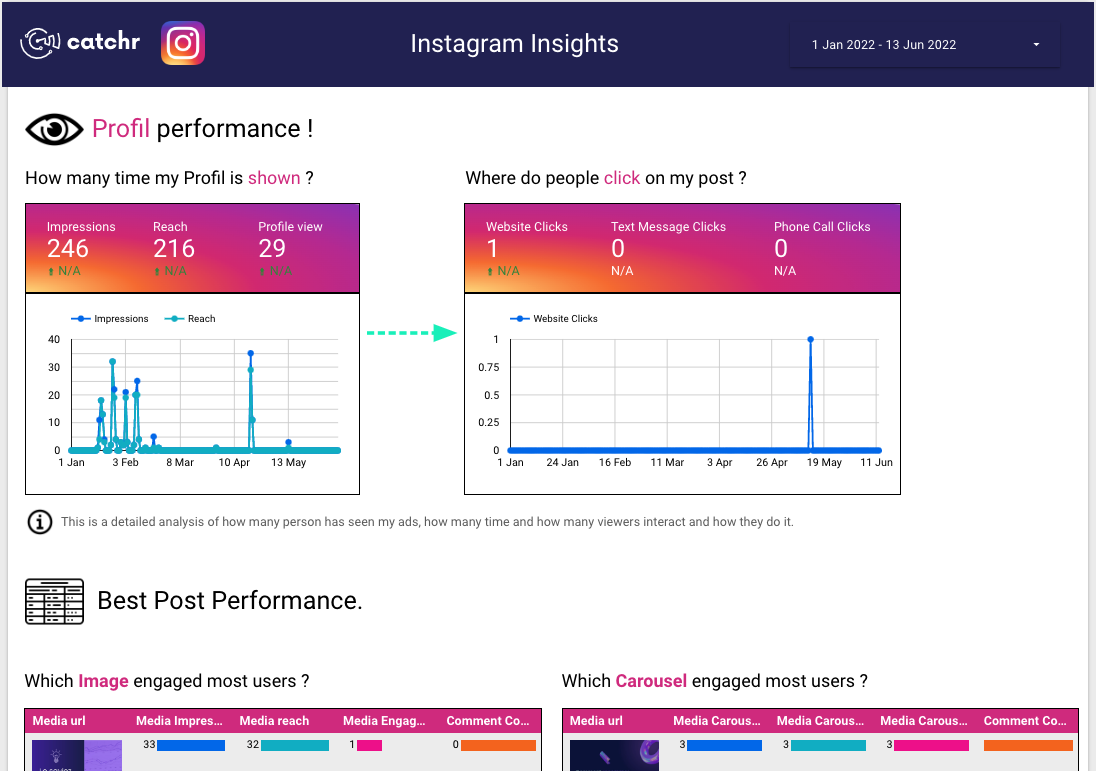
The Instagram overview dashboard gives you a complete view of your account performance in one place. Track key metrics like followers, reach, impressions, and engagement rate to understand your overall growth and visibility on Instagram.
The Instagram follower dashboard helps you analyze your audience growth and demographics. Monitor new followers, unfollows, growth rate, and audience distribution by age, gender, and location to better understand who engages with your content.
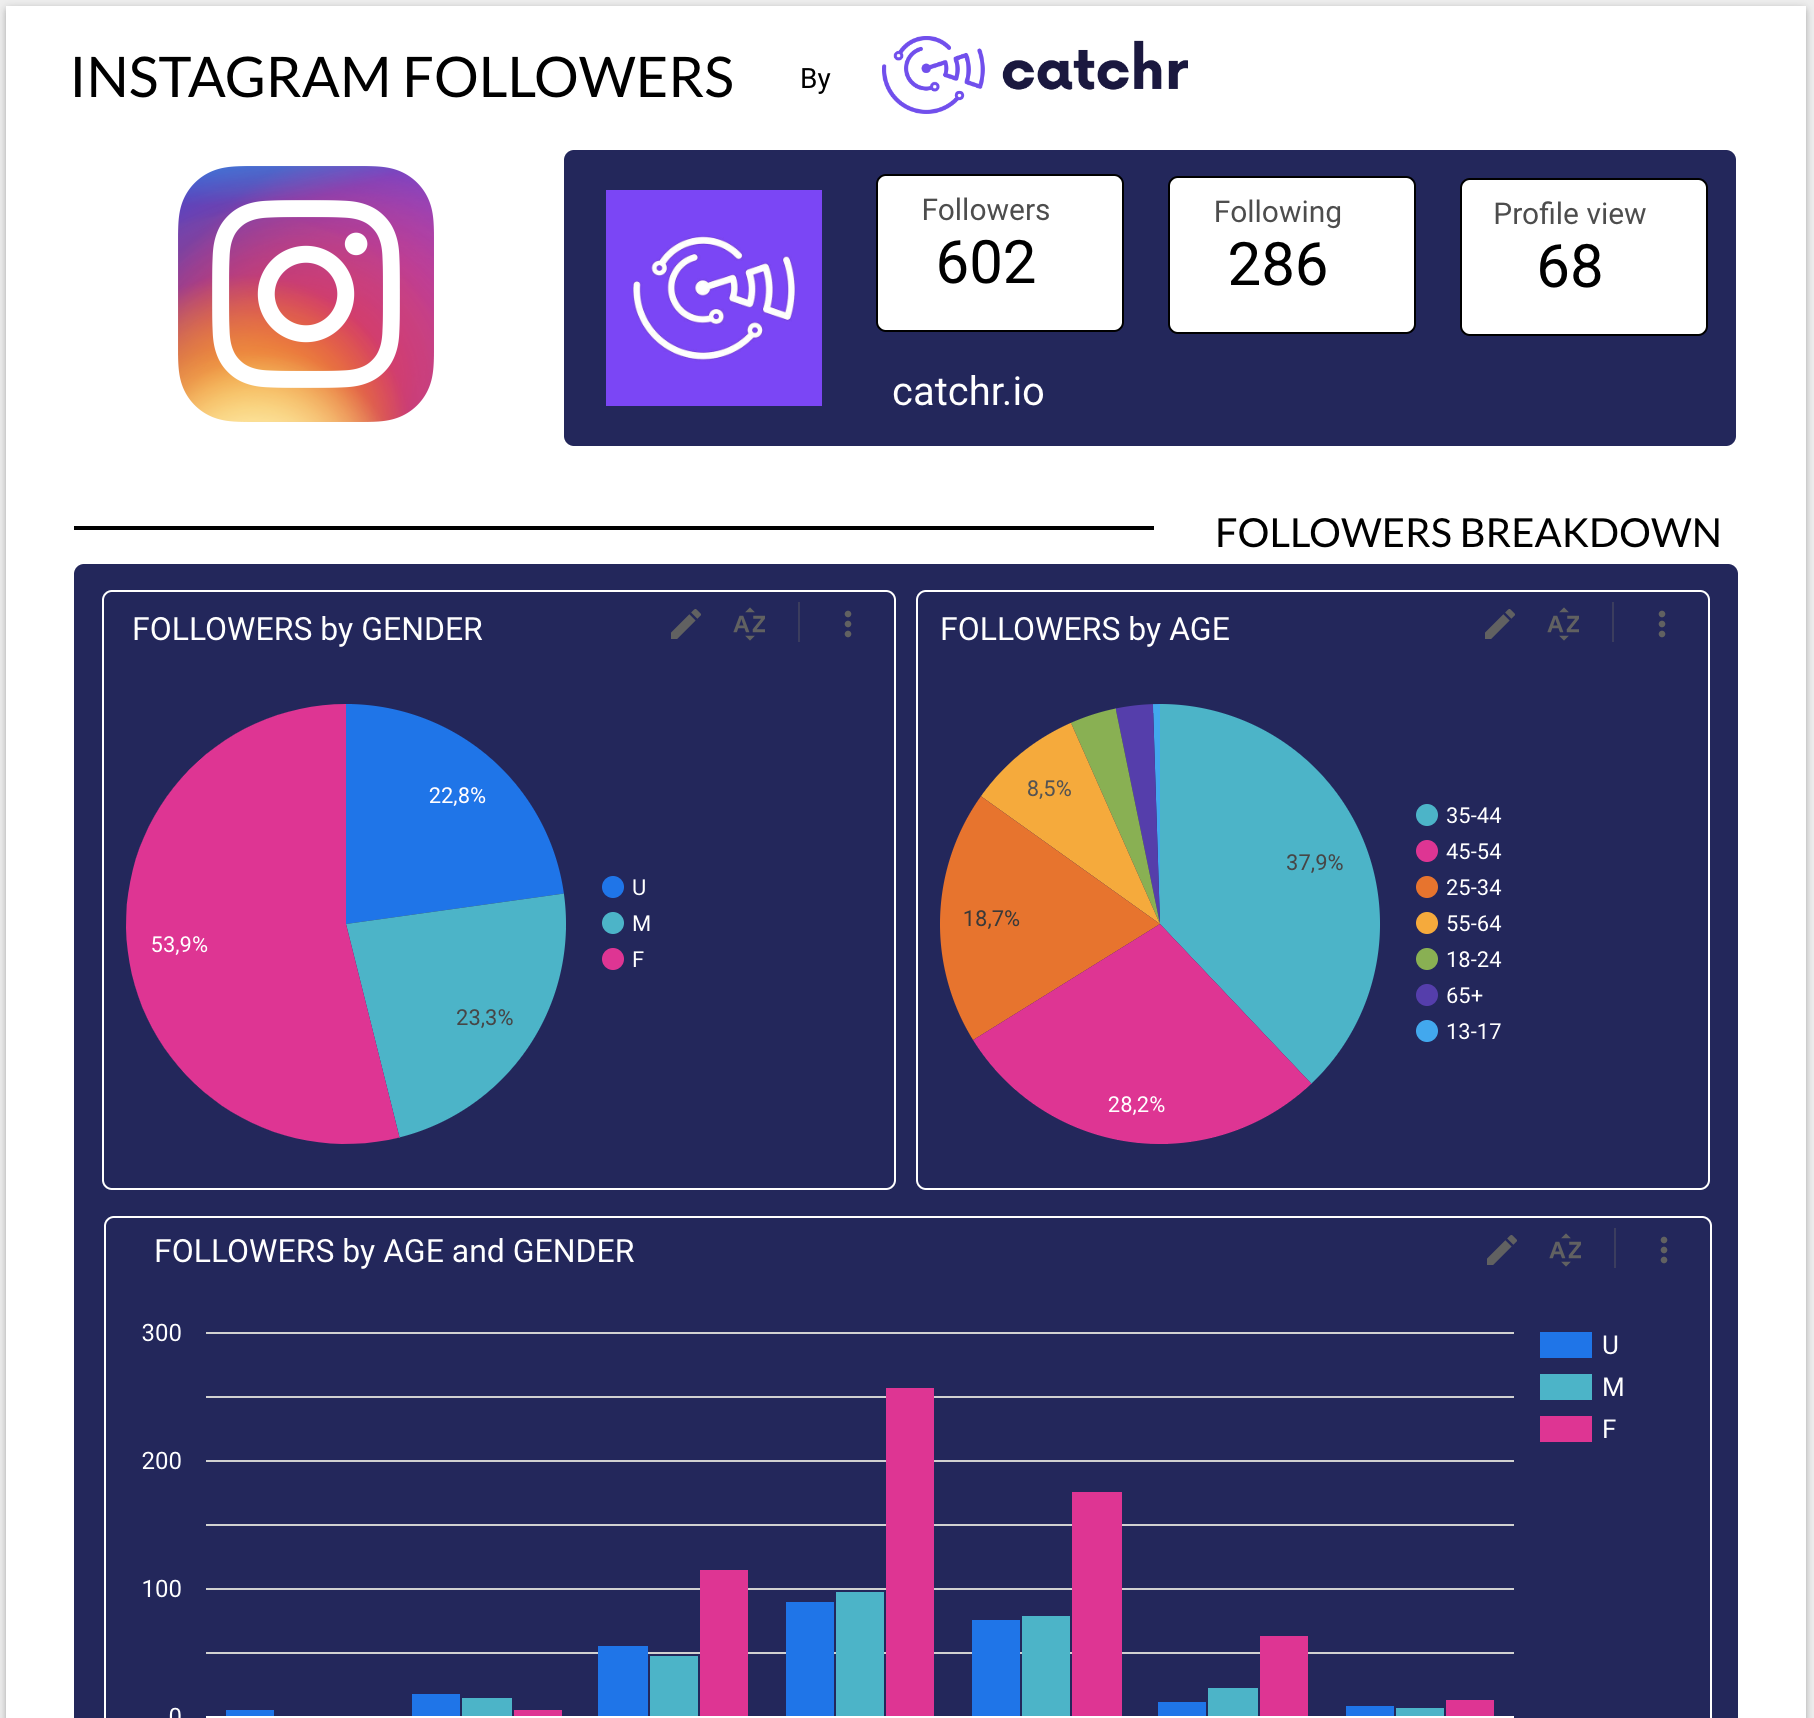
The Instagram post insights dashboard focuses on your content performance. Identify your top-performing posts, reels, and stories by tracking likes, comments, reach, saves, and engagement rate. Use these insights to refine your content strategy and boost audience interaction.
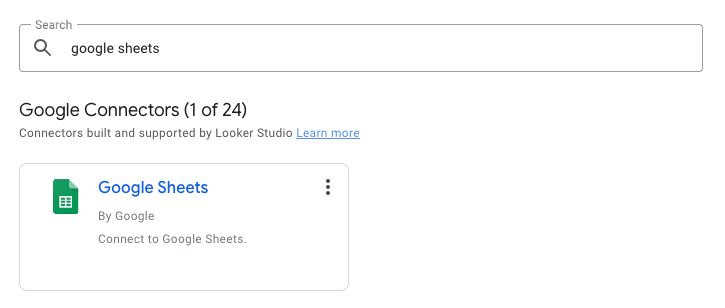
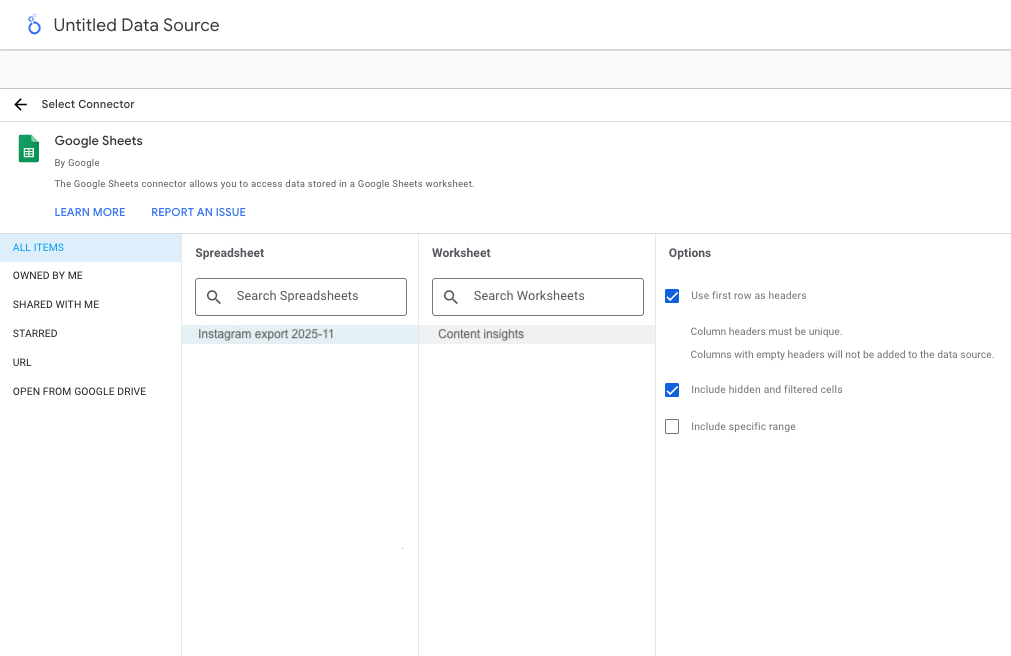
If you prefer a free, manual method, you can use Google Sheets as an intermediary between Instagram and Looker Studio. This approach is simple but requires regular exports or automation via tools like Zapier, Make, or Meta’s Export API.
You’ll export your Instagram performance data (from Meta Business Suite or third-party tools) and import it into Google Sheets. Then, you’ll connect that spreadsheet to Looker Studio using the built-in Google Sheets connector.

If you want dashboards that refresh automatically and always reflect your latest Instagram data, Catchr is the most reliable solution. Google Sheets remains a good option for simple or one-time reports.
Yes. Catchr supports multiple Instagram Business accounts in a single Looker Studio report.
Yes, with Catchr your data refreshes daily. Google Sheets, however, requires manual exports or automation tools.
Absolutely. You can blend Instagram data with Facebook, TikTok, LinkedIn, or GA4 for cross-platform social media analysis.
You can access metrics such as followers, impressions, reach, engagement rate, likes, comments, and content performance. See Catchr’s documentation for the full list of available Instagram fields.
Catchr offers a free trial to connect your Instagram account to Looker Studio. After the trial, a paid plan is required to keep your data automatically synchronized and access advanced features.
Connecting Instagram to Looker Studio helps you track your growth, analyze engagement, and understand what drives your audience. Whether you use the manual Google Sheets method or automate everything with Catchr, you’ll transform your social data into actionable insights that drive better content and results.
Start using Looker Studio with a ready-to-use template
Get the template
Start analyzing your data with a Looker Studio template
Catchr provides free dashboard templates to help you start analyzing your data on Looker Studio — 100+ available templates!
See all the Looker Studio templatesStart using Power BI with a ready-to-use template
Get the template
Start analyzing your data with a Power BI template
Catchr provides free dashboard templates to help you start analyzing your data on Power BI — 20+ available templates!
See all the Power BI templatesStart using Google Sheets with a ready-to-use template
Get the template
Start analyzing your data with a Google Sheets template
Catchr provides free dashboard templates to help you start analyzing your data on Google Sheets — 20+ available templates!
See all the Google Sheets templates✔ 14 days free trial — No credit-card required
✔ 14 days free trial — No credit-card required
Move your Marketing data to your favorite tools
Simplify your data extraction and move all your Marketing data to dashboard tools, spreadsheets, database and more... No code required!
75+ connectors | 20+ destinations
✔ 14 days free trial — No credit-card required


