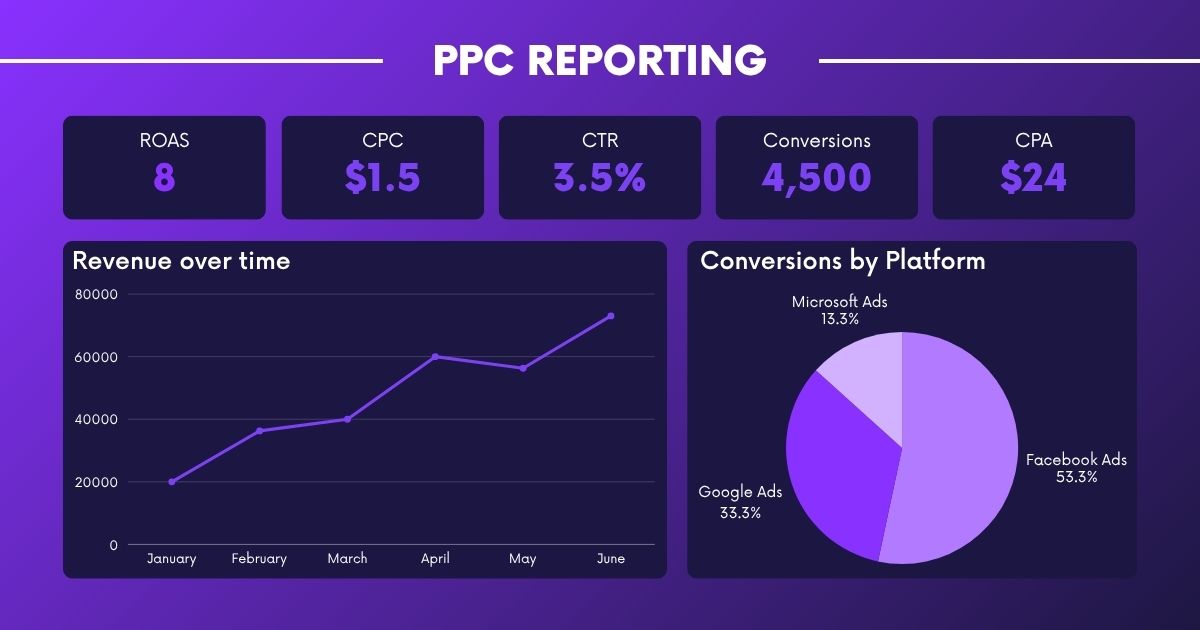
Blog post

Top PPC reporting tools to boost your ad performance

Marketing Dashboard

Florian Cabirol
March 8, 2023
| Lastest update
July 21, 2025

Quick steps to create a report with Google Sheets:

You can easiliy create a report following this step :

  1. Get informations from the data integration from our connector.
  2. Create a source on catchr.io.
  3. Download our Google Sheets extensions.
  4. Configure and run your request
If you need more informations, you can follow the tutorial.

How to install Google Sheets Catchr Add-on.

To start exporting your data to Google Sheets, you need to install the Catchr add-on. You currently have two options :

Option A: Via the marketplace:

  1. Visit the Catchr Add-on page on the Google Workspace Marketplace and click "Install."
  2. Grant the necessary permissions for the add-on.
  3. Upon successful installation, open a Google Sheets to proceed.
Connect Google Sheet to Facebook Ads
Install Catchr Google Sheets Add-on

Option B: Directly within a Google Sheets:

  1. Open a new Google Sheets.
  2. In the top menu, click "Extensions", then hover over "Add-ons" and select "Get add-ons."
  3. Search for "Catchr" and choose "Catchr - data connector."
  4. Click "Install" and grant the required permissions.
  5. Close the installation pop-up when completed.
  6. Start using the Catchr add-on.
Install Catchr Add-on for Google Sheets

Once you have installed the add-on, you can start making requests.

Quick steps to create a report with Looker Studio:

You can easiliy create a report following this step :

  1. Get informations from the data integration from our connector.
  2. Create a datasource and new report on Looker Studio.
  3. Choose your metrics and dimensions.
  4. Use charts with your metrics and dimensions.
If you need more informations, you can follow the tutorial. You can also find a template for at the end of the page.

Quick steps to create a report with PowerBI:

You can easiliy create a report following this step :

  1. Get informations from the data integration from our connector.
  2. Create a source on catchr.io.
  3. Configure your request on the PowerBI request manager.
  4. Copy the given URL in PowerBI
If you need more informations, you can follow the tutorial. You can also find a template for at the end of the page.

Whether you're running ads on Google Ads, Facebook Ads, or Microsoft Ads, tracking performance is essential. The right PPC reporting tools help you monitor key metrics—CTR, CPC, conversion rate, ROI—and give you actionable insights to improve results. In this article, we review the top PPC reporting tools to help you track ROI and scale your paid media strategy.

Why PPC Reporting Tools Matter

PPC reporting tools transform raw ad data into actionable insights. They help marketers monitor performance, optimize spend, and report effectively—whether you're running campaigns on Google Ads, Facebook Ads, or other platforms.

Without clear reporting, it's hard to know what's working. The right tool gives you instant access to key metrics and trends so you can make smarter, data-driven decisions.

Key Metrics to Track

A solid PPC report should cover:

  • CTR (Click-Through Rate) – Measures ad relevance and engagement
  • CPC (Cost Per Click) – Tracks spending efficiency
  • CPA (Cost Per Acquisition) – Evaluates cost-effectiveness
  • Conversion Rate – Assesses landing page performance
  • ROAS (Return on Ad Spend) – Calculates overall profitability

How to choose the right PPC Reporting Tool

With so many tools available, choosing the right PPC reporting solution depends on how well it meets your specific needs.

  • Integration capabilities: Your reporting tool should connect easily to all major advertising platforms—Google Ads, Meta Ads, Microsoft Ads, TikTok Ads, LinkedIn Ads, and more. Tools like Catchr, Supermetrics, and Funnel.io offer wide connector libraries to centralize paid media data in Looker Studio, Power BI, or Tableau.
  • Customizable dashboards and reports: Choose a tool that allows you to tailor your reports to your unique KPIs. Whether you need to report per channel, per campaign, or per client, flexibility is key. → Looker Studio paired with connectors like Catchr or Supermetrics gives complete flexibility in layout, filters, and data views.
  • Automation and scheduling: Time-saving automation is a must. Look for tools that sync data daily (or hourly), and can schedule reports for teams or clients. → Catchr, Whatagraph, and DashThis support automated syncing and recurring reports.
  • Multi-channel reporting: If you're running campaigns on multiple platforms, choose a tool that consolidates all your data into one unified view. This helps compare performance across channels and make informed budget decisions.
  • Ease of use and collaboration: A user-friendly interface saves time and reduces onboarding friction—especially for teams or clients. Look for tools that simplify data visualization, allow quick sharing (live links or exports), and support collaboration.
Ads Performance dashboard on Looker Studio

Top 7 PPC reporting tools by type in 2025

The PPC reporting landscape is broad, but not all tools serve the same purpose. Some are ideal for in-platform monitoring, others for advanced data visualization or agency-ready reporting. Here’s a categorized breakdown of the top 7 tools in 2025 to help you find the right fit for your needs.

Tool Best For Pros Cons Pricing
Looker Studio Custom dashboards via connectors Free, highly flexible, supports visual customization, works well with tools like Catchr or Supermetrics Requires setup and external connectors, lacks built-in advanced analytics features Free
Power BI Enterprise analytics Powerful data modeling, deep Microsoft 365 integration, suitable for large-scale reporting Steep learning curve, not tailored to marketing-specific needs From $10/month
Tableau Visual storytelling Rich data visualization, highly customizable reports, enterprise-ready features High cost, complex setup for marketing teams, may require technical support From $75/month
Microsoft Excel Advanced data manipulation offline Powerful formulas and pivot tables, offline access, supports add-ins and Power Query Less collaborative, manual setup for connectors, limited built-in visualization Included in Microsoft 365 plans
Google Sheets Flexible, online spreadsheet reporting Free, cloud-based, great for collaboration, compatible with connectors like Catchr and Supermetrics Limited charting, performance issues with large datasets, manual formatting Free
DashThis Quick, ready-made dashboards for clients Very easy to use, includes white-labeling, supports automated PDF or link-based reporting Limited design flexibility, not ideal for advanced metric customization From $45/month (for 3 dashboards)
Whatagraph Visual, real-time PPC reports for teams and clients Strong visual templates, real-time data sync, collaboration and client access features Limited support for custom calculations, expensive for large teams or multiple clients From $199/month

Native Reporting Views (Built-In Tools)

Every PPC platform provides a built-in way to view your marketing data. While these native reports are fine for quick checks—like “how much did I spend yesterday?”—they often fall short in terms of data visualization, customization, and overall user experience.

If you're managing campaigns for clients, relying on platform-native reporting is rarely a viable option. Clients expect clear, branded, and visually engaging dashboards—not login access to a complex ad interface. A dedicated reporting solution ensures they see the right data, presented the right way, without unnecessary friction.

Visualization Tools

These tools are ideal for building custom dashboards and sharing data-rich reports with teams or clients.

Visualization tools could help you provide detailed analytics and make a beautiful PPC dashboard for your clients. You need a way to extract the data from your marketing source to put it in the tools. But you could efficiently work on your data once the step is done.

Looker Studio (formerly Google Data studio)

Looker Studio is a free and powerful tool for creating interactive, responsive dashboards. With its user-friendly interface and wide range of charts, templates, and branding options, it allows marketers to build custom reports without technical expertise. It’s perfect for visualizing key metrics and supporting data-driven decisions. However, Looker Studio is sometimes slow and lacks advanced native analytics features.

You can use external connectors like Catchr or Supermetrics, to connect your Ads data from multiple platforms.

Pricing: Free

Looker Studio

Power BI

Power BI is a flexible BI platform that lets users connect, visualize, and share data from multiple sources through interactive dashboards and reports. It’s ideal for organizations of all sizes and integrates seamlessly with Microsoft tools like Excel and Teams. However, it has a steeper learning curve and isn’t tailored specifically for marketing use cases.

You can use external connectors like Catchr or Supermetrics, to connect your Ads data from multiple platforms.

Pricing: From $13.70/month

Power BI

Tableau

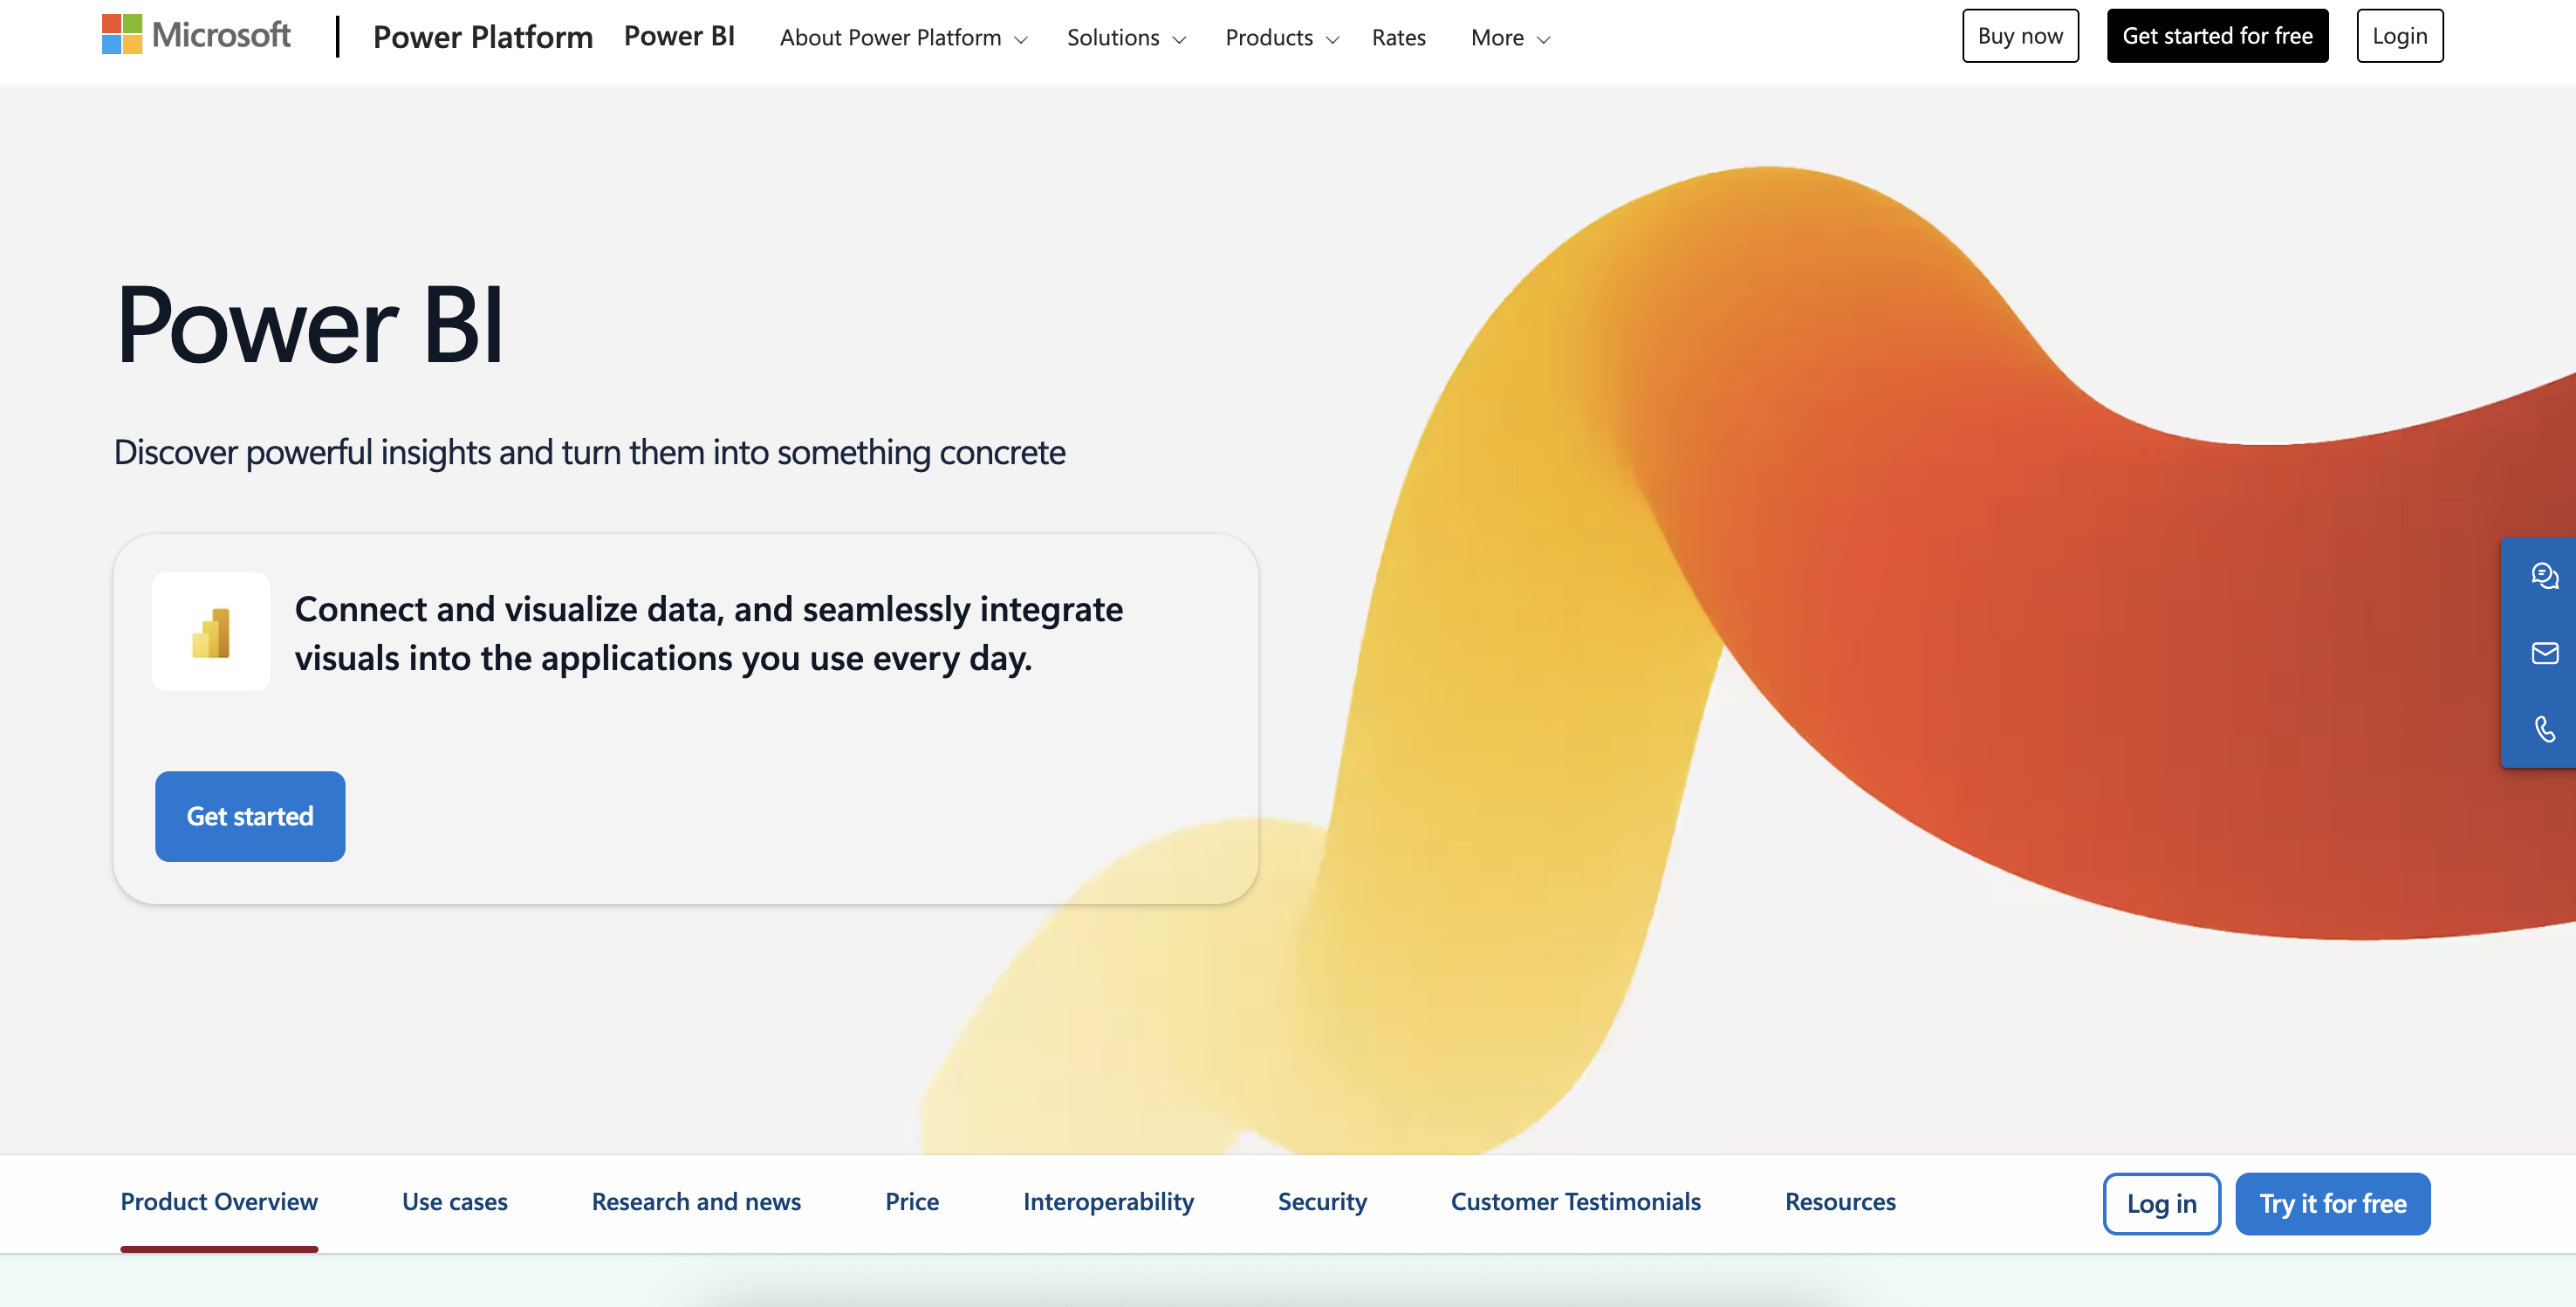
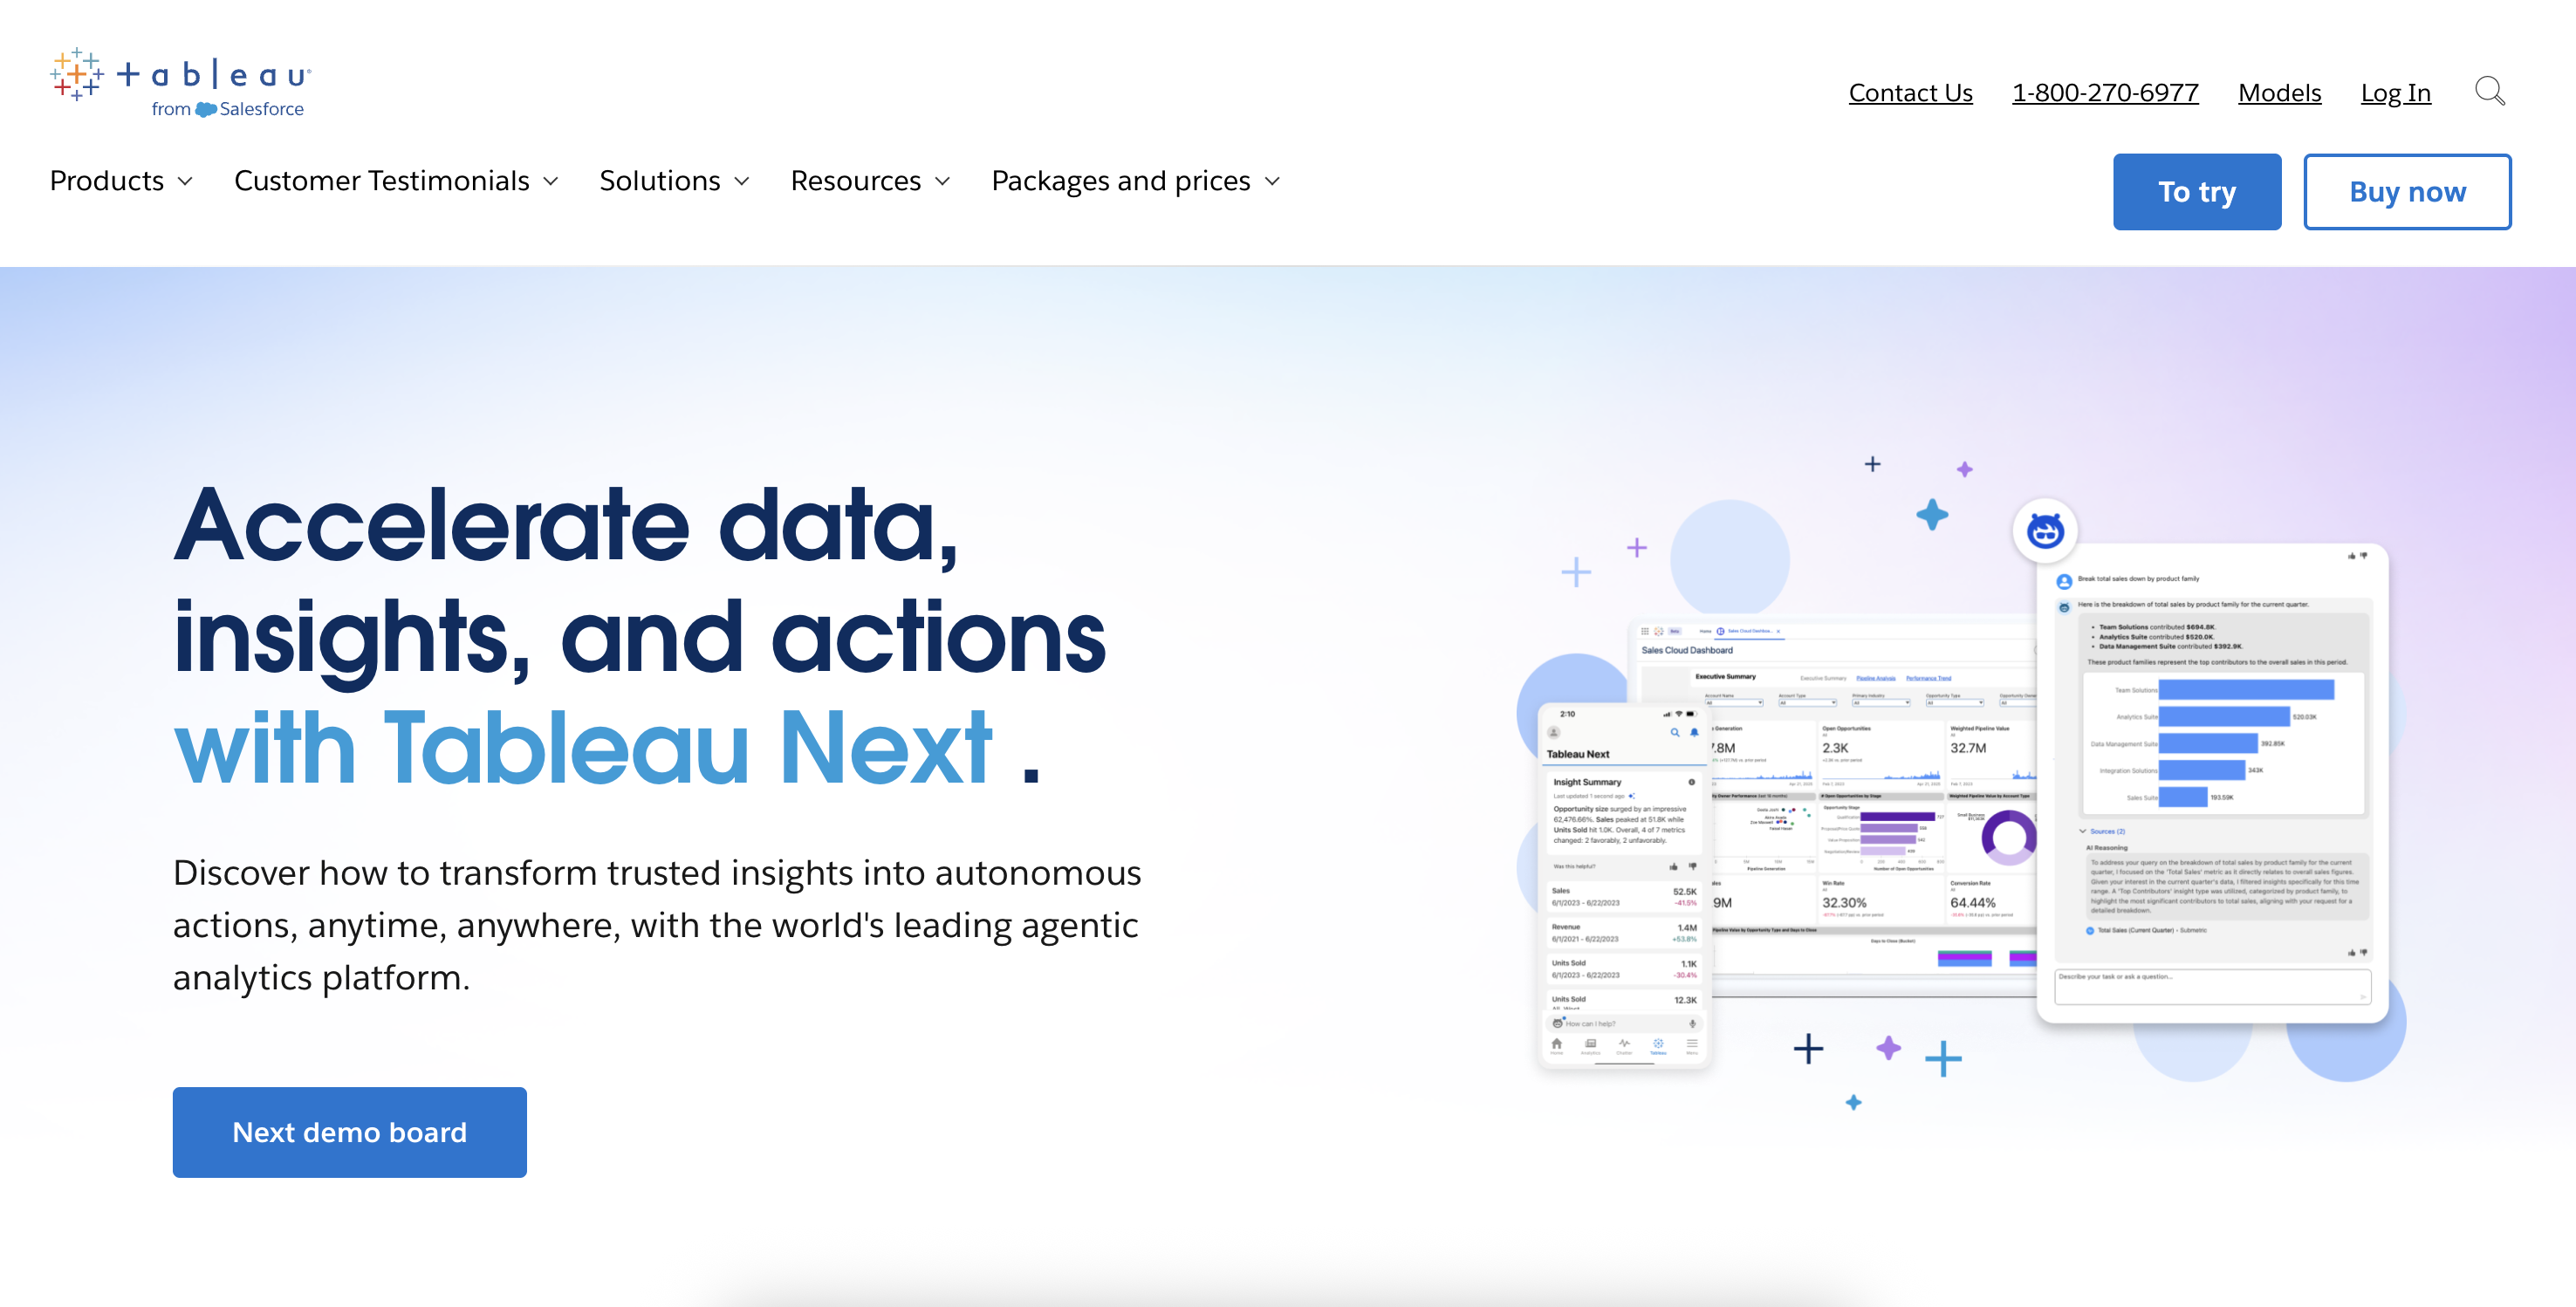
Tableau is a robust data visualization platform designed to help teams explore and understand complex data through interactive dashboards. It offers advanced customization and is well-suited for analysts and large organizations. However, it requires technical skills, has a steeper setup process, and may be overpowered for basic marketing needs.

You can use external connectors like Catchr, to connect your Ads data from multiple platforms.

Pricing: From $75/month

Tableau
Tool Best For Pros Cons Pricing
Looker Studio Custom dashboards via connectors Free, flexible, works well with tools like Catchr or Supermetrics Requires setup, limited advanced analytics Free
Power BI Enterprise analytics Powerful modeling, Microsoft 365 integration Steep learning curve, not marketing-specific From $10/month
Tableau Visual storytelling Highly visual, rich data features Expensive, complex setup for marketing teams From $75/month

Spreadsheets & Connectors

Excel and Google Sheets offer full control over your PPC data. While replicating visual dashboards requires complex formulas and formatting, spreadsheets remain highly effective for quick overviews or as a reliable data source—especially when combined with connectors like Catchr.

Microsoft Excel

Microsoft Excel is a widely used spreadsheet tool included in the Microsoft Office suite. It allows users to organize, analyze, and manipulate data with powerful formulas, pivot tables, and charting capabilities. For marketers and analysts, Excel becomes even more valuable when paired with add-ins like Catchr, which enables you to import live data from advertising platforms such as Google Ads, Meta Ads, or Microsoft Ads directly into your workbooks. This integration helps streamline PPC reporting, automate data refreshes, and centralize campaign performance in a format familiar to most teams.

Microsoft Excel
Microsoft Excel

Google Sheets

Google Sheets is a cloud-based spreadsheet tool that enables real-time collaboration from any device. It allows users to explore, edit, and share data easily, with built-in features like comments, version history, and task assignments that streamline teamwork. When paired with an add-on like Catchr, Google Sheets becomes a powerful PPC reporting tool—letting you automatically pull data from platforms like Google Ads, Meta Ads, or Microsoft Ads directly into your spreadsheets. This makes it easier to centralize campaign metrics, automate reporting, and keep stakeholders aligned with live, up-to-date performance data.

Google Sheets
Google Sheets
Tool Best For Pros Cons External Connectors
Microsoft Excel Advanced data manipulation offline Powerful formulas, pivot tables, Excel add-ins available Desktop-based, less collaborative, technical setup for connectors Catchr (via Power Query), APIs
Google Sheets Flexible, online spreadsheet reporting Free, collaborative, works with add-ons like Catchr or Supermetrics Limited visuals, manual setup, performance issues with large datasets Catchr, Supermetrics, APIs

All-in-One Reporting Tools

All-in-one PPC reporting tools are designed to help marketers and agencies create, visualize, and deliver reports in a single platform—without needing external tools like Looker Studio, Power BI, or spreadsheets. These solutions are ideal for those who want ready-to-use dashboards, multi-channel data aggregation, and automated report sharing in just a few clicks.

What sets them apart is their built-in interface that combines data integration, visual reporting templates, and client-ready outputs (PDF, email, shareable links). No connectors, coding, or BI knowledge required.

Here are two of the leading all-in-one PPC reporting tools in 2025:

DashThis

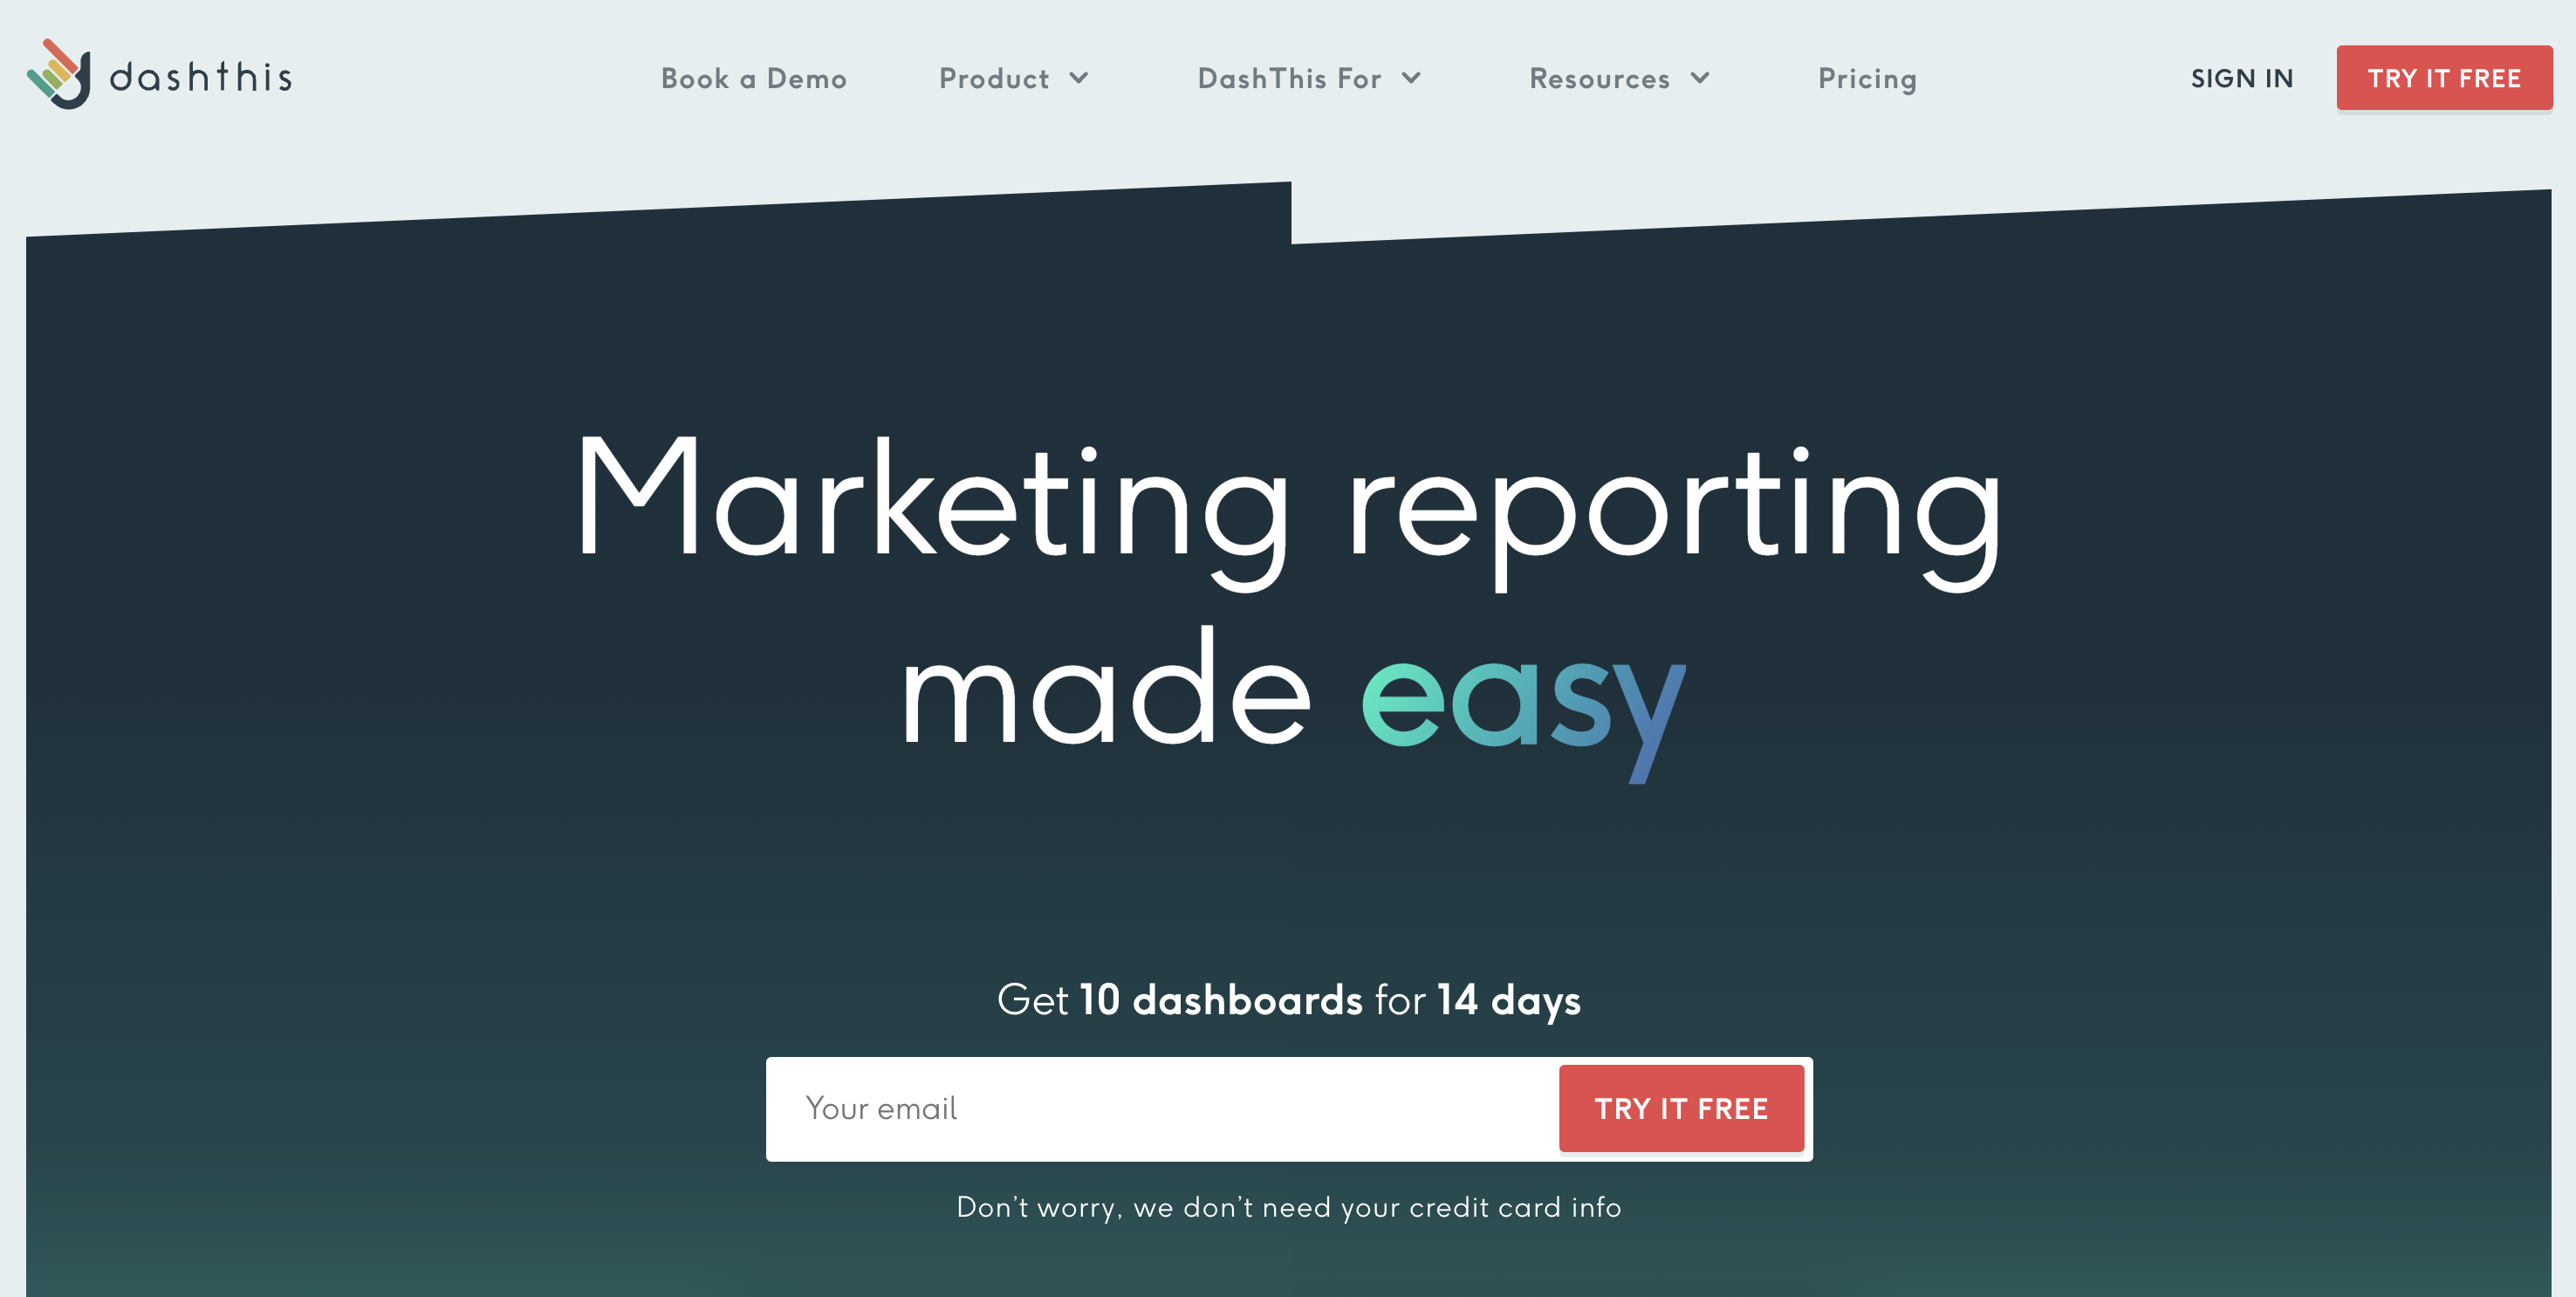
DashThis is an all-in-one PPC reporting tool designed for marketers and agencies who want to create and share reports quickly without relying on spreadsheets or BI tools. It offers native integrations with major platforms like Google Ads, Meta Ads, and LinkedIn Ads, and includes pre-built templates, automated report delivery, and white-label options for client-facing dashboards.

DashThis is ideal for users looking for speed and simplicity. However, it offers limited customization compared to advanced tools and may not meet the needs of teams requiring complex calculations or highly tailored layouts.

Pricing starts at $45/month for 3 dashboards, with plans scaling based on the number of reports and users.

DashThis

Whatagraph

Whatagraph is a visual reporting platform that helps marketing teams and agencies build real-time, multi-channel dashboards with minimal effort. It supports integrations with platforms like Google Ads, Meta Ads, HubSpot, and more, and allows for client access, branded reports, and scheduled delivery. The platform stands out for its clean design and user-friendly interface.

While Whatagraph is powerful for presentation and collaboration, it’s less suited for advanced data transformation or custom formulas. It can also become expensive as you scale to more users or clients.

Pricing starts at $199/month, with features and access varying by plan.

Whatagraph
Tool Best For Pros Cons Pricing
DashThis Quick, ready-made dashboards for clients Very easy to use, includes white-label options for agencies, allows scheduled reports via email or PDF Limited design flexibility, not suitable for advanced metric customization From $45/month (for 3 dashboards)
Whatagraph Visual, real-time PPC reports for teams and clients Strong visual templates, real-time data updates, includes collaboration and client access features Limited support for custom formulas or data transformations, higher cost for large teams or agencies From $199/month

What to remember about PPC reporting

In the end, choosing the right PPC reporting tool comes down to your goals, your team, and your clients.

Need flexibility and full control? Tools like Looker Studio combined with a connector like Catchr offer the best balance between customization, automation, and cost. Prefer working in Excel or Google Sheets? Catchr also lets you sync live ad data into your spreadsheets for quick analysis or internal tracking.

For enterprise-level reporting, Power BI or Tableau may be worth the investment. If simplicity and speed are your top priorities, all-in-one tools like DashThis or Whatagraph deliver ready-to-use reports with minimal setup.

Whatever your tool of choice, Catchr helps you centralize all your paid media data and automate reporting across platforms—so you can focus on performance, not data wrangling.

Because good reporting isn’t just about metrics—it’s about making better decisions, faster.

No items found.

In this template, you will find all the metrics and dimensions you would need to get a better view of your data.

If you need more templates, you could look at our looker studio template gallery.

No items found.

In this template, you will find all the metrics and dimensions you would need to get a better view of your data thank to our integrations.

If you need more templates, you could look at our PowerBI template gallery.

Looker studio

Start analyzing your data with a Looker Studio template

Catchr provides free dashboard templates to help you start analyzing your data on Looker Studio — 100+ available templates!

See all the Looker Studio templates

Start analyzing your data with a Looker Studio template

Catchr provides free dashboard templates to help you start analyzing your data on Looker Studio — 100+ available templates!

See all the Looker Studio templates

Start analyzing your data with a Power BI template

Catchr provides free dashboard templates to help you start analyzing your data on Power BI — 20+ available templates!

See all the Power BI templates

Start analyzing your data with a Power BI template

Catchr provides free dashboard templates to help you start analyzing your data on Power BI — 20+ available templates!

See all the Power BI templates
Google Sheets

Start analyzing your data with a Google Sheets template

Catchr provides free dashboard templates to help you start analyzing your data on Google Sheets — 20+ available templates!

See all the Google Sheets templates

Start analyzing your data with a Google Sheets template

Catchr provides free dashboard templates to help you start analyzing your data on Google Sheets — 20+ available templates!

See all the Google Sheets templates

Connect all your Marketing data to

Simplify your data extraction with 75+ marketing data connectors to easily move your data to . No-code integration!

Start your free trial

✔ 14 days free trial — No credit-card required

Easily connect your to

Move your data from to with Catchr's no-code integration. Easy to set up, always up-to-date. Automate your data extract now!

Connect your data to multiple destinations

Easily integrate your data thanks to Catchr's no-code connector. Move your data to dashboard tools, spreadsheets, database and more... 20+ destiantions available

Start your free trial

✔ 14 days free trial — No credit-card required

Move your Marketing data to your favorite tools

Simplify your data extraction and move all your Marketing data to dashboard tools, spreadsheets, database and more... No code required!
75+ connectors | 20+ destinations

Start your free trial

✔ 14 days free trial — No credit-card required

Unlock Insights with Style!

Transform your marketing data into stunning dashboards.

Integrate, visualize, and impress with Catchr's seamless dashboards. Elevate your data game now!
Build your first report
14 days free-trial - No credit card required 🎉

More blog post about

No items found.