How to build campaign performance page in Power BI
Learn how to build a Google Ads campaign performance page in Power BI using a matrix, key KPIs, filters, and benchmarks to analyze and compare campaigns effectively.
A campaign performance page is the natural next step after a marketing overview dashboard. While the overview focuses on global performance, this page is designed to help teams compare campaigns, identify priorities, and decide where to act.
In this article, we’ll focus on a Google Ads campaign performance page, using paid media data to illustrate how to structure the page, choose the right visuals.
The role of a campaign performance page
A campaign performance page is built to support analysis and optimization decisions, not just reporting. Its purpose is to move from a high-level snapshot to a more actionable view, while remaining structured and readable.
Its role is to:
- compare campaigns objectively using consistent KPIs
- highlight top-performing and underperforming campaigns
- allow controlled drill-down into ad groups and ads
This page is not meant to replace the Google Ads interface or show every available metric. It should not try to answer all questions at once. Instead, it acts as an analysis layer, helping teams prioritize actions based on performance signals.
Core elements of a Google Ads campaign performance page
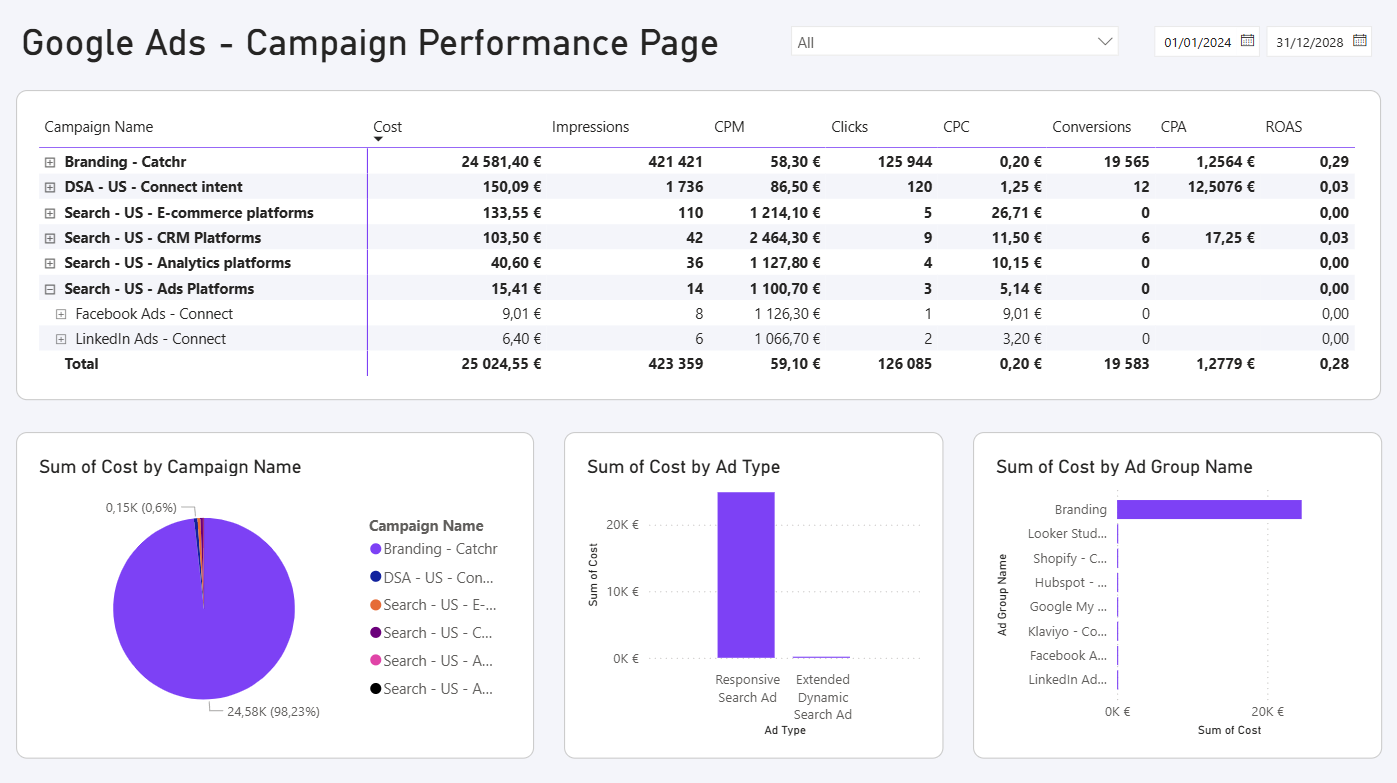
Campaign performance matrix
Instead of using a simple table and a separate drill-down mechanism, you can build a single Matrix visual that shows campaign performance and lets users expand into deeper levels directly inside the same view.
In a Google Ads context, the matrix is structured as a hierarchy:
- Rows: Campaign → Ad group → Ad (or Asset group for Performance Max)
- Values: Impressions, Clicks, Cost, Conversions, plus efficiency KPIs like CPC, CPA, and ROAS
This format is extremely effective because it combines two needs in one place: you can compare campaigns at a glance, then expand a specific campaign to immediately see which ad groups or ads are driving results.
Performance distribution and benchmarks
Beyond averages, it’s important to understand how performance is distributed across campaigns and how it compares to targets.
Useful approaches include:
- bar charts comparing campaign CPA or ROAS
- benchmark lines representing target CPA or ROAS
- conditional formatting in tables to flag outliers

This makes it easier to spot campaigns that are clearly underperforming or exceeding expectations.
Filters and context control
Filters on a campaign performance page should remain consistent with the overview dashboard to ensure reliable comparisons.
Common slicers for a Google Ads campaign page include:
- date range
- campaign type (Search, Display, Performance Max)
- campaign name

These filters allow users to refine analysis without changing KPI definitions or breaking consistency across reports.
Layout and usability best practices
Campaign performance pages often contain dense information, but usability should remain a priority.
Good practices include:
- placing the campaign table at the top or center of the page
- using charts to complement, not duplicate, the table
- keeping metric order consistent with the overview dashboard
- avoiding unnecessary visual clutter
Key takeaways for building a Google Ads campaign page
A well-designed Google Ads campaign performance page turns paid media data into actionable insights. By combining a structured campaign table, controlled drill-down, and clear benchmarks, Power BI becomes a practical tool for campaign optimization.
This type of page helps teams move beyond surface-level reporting and focus on what truly drives performance.
.svg)