This banner can be used to inform vistors of something important.
Learn more
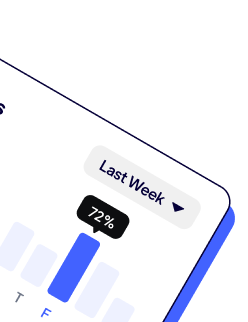
You can easiliy create a report following this step :
To start exporting your data to Google Sheets, you need to install the Catchr add-on. You currently have two options :
Option A: Via the marketplace:

Option B: Directly within a Google Sheets:

Once you have installed the add-on, you can start making requests.
Data insights empower business enthusiasts and global e-commerce startups to make informed decisions and upgrade their digital marketing strategy for optimal growth. Analyzing customers’ data correctly is challenging when there is a huge pile of information.
Well, that’s where BigQuery comes to your rescue. It is a leading data analytics tool which helps more than 10,000 customers store, process, and analyze tremendous amounts of data in a fraction of the time.
BigQuery is a simplified and fully managed cloud data warehouse that, if employed right, can take your business to new heights. In this guide, we will walk you through the ins and outs of this incredible platform and discuss everything you need to get a headstart over your competitors.
At its core, BigQuery is a cloud-based solution for visualizing, managing, and analyzing robust datasets regardless of their size. The platform is blazing fast and serverless, processing petabytes above petabytes of data in a few minutes. It can include anything, from massive digital records to real-time streaming data from your web browser, mobile apps, or IoT devices.

As already established, Bigquery is used for data exploration and management, but when to utilize the platform is another significant aspect we can’t skip.
BigQuery creates a single source of truth for gigantic datasets. In other words, users import files from numerous resources into a single cloud-based storage to accelerate progress and boost data analysis efficiency.
Being a reliable warehouse, Bigquery is a preferred choice for multi-scale businesses for storing columnar data and avoiding privacy invasions by malicious hackers.
BigQuery is like gold dust for new data analysts across the globe. It employs structured query language (SQL), making it accessible and comprehensive for unseamed data scanning.
While it is mainly an exploration tool, many digital markers and social media influencers use BigQuery to visualize data with Looker Studio, Tableau, or Catchr. It helps them build pleasing visual dashboards and KPI reports, giving detailed insights regarding their business.
Entertaining unified data analytics, BigQuery smoothly acts on 4 main features.
BigQuery is a decent platform for data analysis with a well-organized, systematic hierarchy. The 4 main components of the system include the following:
Immaculate and complex, machine learning demands an in-depth skill to make sense of fancy algorithms. But with BigQuery ML under your belt, you can use your fundamental and existing SQL skills to build intricate machine-learning models in no less than 10 minutes.
According to Google Cloud, this simplification paves the way for customer segmentation, predictive forecasts, product recommendations, and much more. So, just head to the BQ browser and follow these steps to get started:
BigQuery provides an ad hoc analysis feature to address specific data questions related to your business. Using SQL fundamentals, you can run your queries directly in the Google Console or through third-party tools like Catchr.

The BigQuery BI engine is a remarkable extension of the native BQ engine that may be even better. It lets you run different queries on massive datasets with a seamless integration facility. Speaking of some notable advantages, the BI engine incorporation can perform:
However, this specific data analysis feature is not free of limitations. It broadcasts tables restricted to a 20-file limit, so you should reduce the total files or consider merging them before the process. You can always change your strategy according to the data type on hand.
The enhanced geospatial capabilities in BigQuery are crucial to analyzing location data and making more informed decisions for your business’s future. Whether predicting the hotspot for your upcoming store or identifying the geographical location of your customers, BQ GIS sets everything right at your fingertips.
You can also use BigQuery Geo Viz, a lightweight visualization tool, to run a simple SQL query and showcase the location data on Google Maps, Google Earth Engine, or Jupyter Notebooks based on your preferences.
BigQuery has remained a squeaky big name in the realm of data analytics ever since its initial launch in 2010. Needless to say, the technology offers endless benefits in maximizing the pay-per-click (PPC) business marketing approach. However, it still presents some challenges when it comes to the initial learning curve and intense prices.
Come along as we explore this good and bad side below in more detail.
Powered by hundreds of thousands of data centers, BigQuery performs exceptionally well with extensive amounts of data. The more queries you have, the more servers it will add to match and process the increasing workflow. Besides ensuring a swift and seamless performance, it scales the procedure for global businesses, anticipating a prompt yet accurate output.
BigQuery screens and manages multiple data queries in a blink. Simply press ‘Run Query’ and let BQ read the gigantic terabytes, remove redundant files, and distribute enormous data across the network in a few magical seconds. The system has ample resources like a fast gigabit network merged with hundreds of dedicated hard drives to execute this task at light speed.
Based on a multi-cloud service, BigQuery is ready to run data queries from the get-go without users having to install any software. It makes the platform super intuitive and user-friendly, encouraging more progress in less time. With the recent schema support update, you can add column descriptions within views and offer more clarity when transferring the data to others.
The BigQuery infrastructure is not just lightning-fast and simple, it is also bottom-line safe. For organizations that need large-scale data distribution and sharing across different platforms, BQ-authorized views and encryption are ideal. You can customize the accessible parts of the data and share it with specific users to avoid privacy risks.
More than 70% of companies depend on data centralization. Using this facility, companies collect consumer data in one place and streamline the analysis procedure for enhanced business efficiency and better growth. Built on a similar mechanism, BigQuery is compatible with abundant data resources and helps them perform cross-domain reporting with ease.
Although the interface and functionality are quite simple, learning how to use BigQuery’s advanced features is not. The platform excels in processing basic queries, but reaching its full potential with complex data analysis may require some time and effort. It is a downside for big data firms and organizations aiming to extract more value in a minimum time.
Many operations in BigQuery are free of charge. However, the pricing structure that comes with processing queries and storing the data on this platform is hard to manage in the long run. Google keeps charging you based on the volume of queries you decide to store, process, and analyze over time.
The best way to prevent the increasing costs is to learn the standard SQL practices before querying your datasets. For Instance, split large chunks of queries into smaller and digestible pieces to optimize the amount of data processed.
While the pay-as-you-process model seems flexible, it can pose concerns for businesses or social media marketers with budget constraints.
Despite a few drawbacks, BigQuery is a trusted name in the field of business. To maximize its potential, many rely on Catchr for extracting and analyzing their data with minimal work and zero coding experience. Unlike the premium BQ platform, this tool is easy to learn and light on the pocket for everyone without exception.
With Catchr, marketers build up dynamic dashboards that update in real-time and digital marketing reports that give an updated picture of metrics, trends, and cross-platform KPIs. In case you scratch your head in confusion and think: what makes it stand out from other visualization tools in the market? Take our word, as we offer:
So, another time when you analyze data, remember to make the most of it through Catchr.