This banner can be used to inform vistors of something important.
Learn more

You can easiliy create a report following this step :
To start exporting your data to Google Sheets, you need to install the Catchr add-on. You currently have two options :
Option A: Via the marketplace:

Option B: Directly within a Google Sheets:

Once you have installed the add-on, you can start making requests.
Gone are the days when you’d post one day at 3 AM and the other at 6 PM, trying to catch your audience when they’re the most active. Now, data is the bedrock behind all marketing decisions, turning hunches into actionable insights. Based on a McKinsey report, businesses that take the time to understand consumer behavior outperform their competition by 85% in sales growth.
This is where Looker Studio comes in: a user-friendly platform that helps you visualize, analyze, and share data. By turning complex data sets into simple, easy-to-understand reports and dashboards, Looker Studio helps businesses draft data-driven marketing campaigns that lead to growth. But how much do you need to invest in this Google-backed visualization tool? Well, read on for a detailed guide to Looker Studio pricing.
Google Looker Studio, previously known as Google Data Studio, is an all-in-one data visualization and business intelligence tool released by Google. The platform helps you make informed decisions in real time by transforming raw data into informative reports and customizable dashboards.
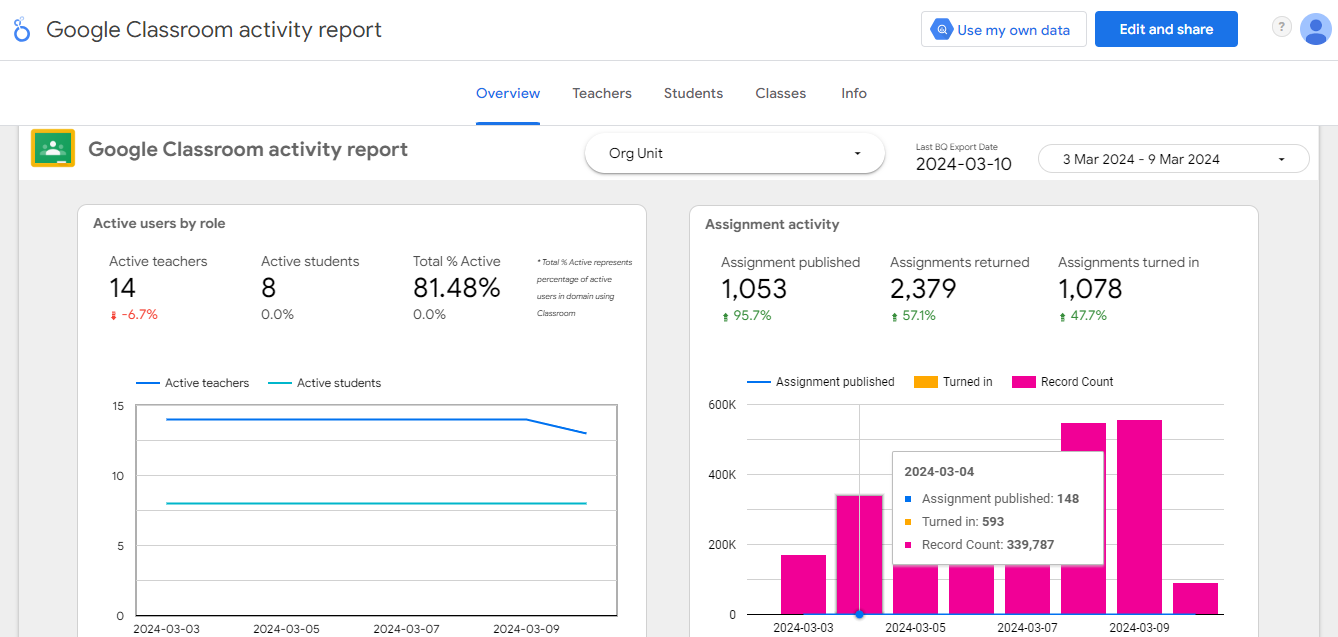
At Looker Studio, you can pull together data from all your marketing sources, like your website’s traffic stats from Google Analytics, sales numbers from Excel sheets, or even social media engagement metrics (from Facebook or Instagram). Looker Studio also allows businesses to visualize their marketing data using graphs, charts, maps, and more, telling them the story behind their numbers.
In simple words, Looker Studio isn’t about making things look pretty (though it does a great job at that); it’s about making data easier to understand at a glance. Thanks to its customizable nature, the platform also lets you tweak the reports to focus on the KPIs you desire. For example, if you’re an e-commerce store and want to see which products are selling the best in a certain region, you can filter and drill down your dashboard to help you do that!
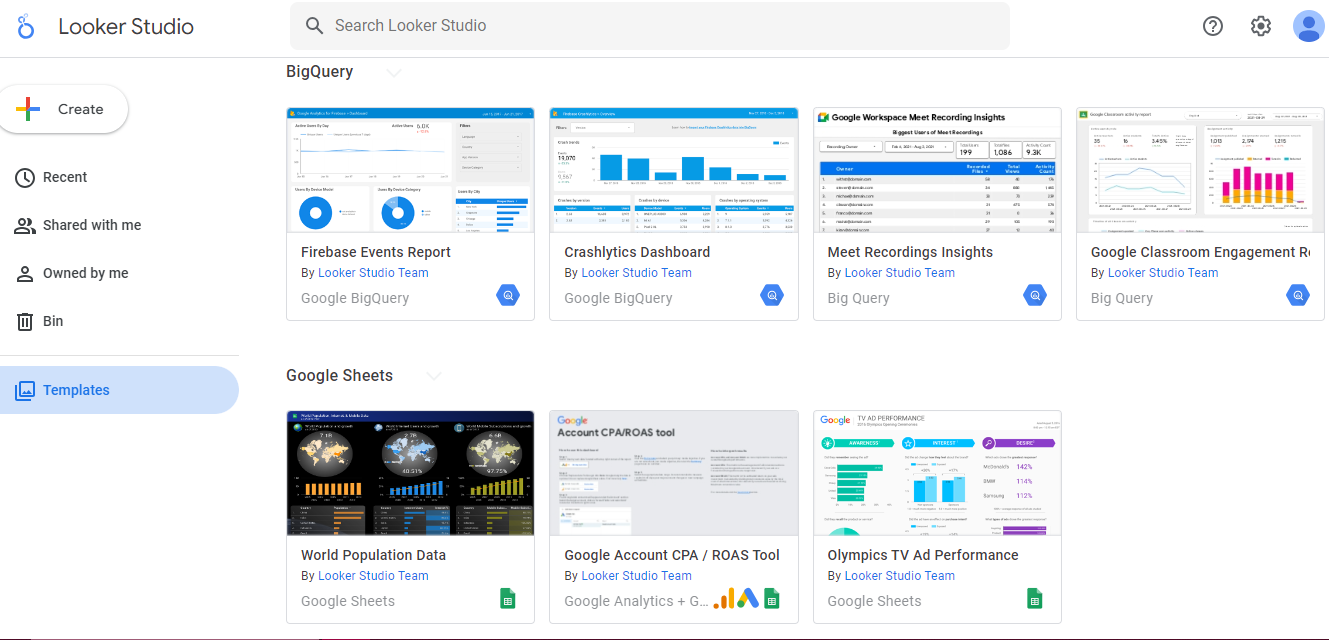
Google Looker Studio is a free data visualization tool that lets businesses create customizable reports and appealing dashboards. The platform is ideal for individuals and small teams (with less than 5-10 SKUs) looking to understand their numbers story without investing too much. Here are the key offerings of the free version:
Now, you might be thinking, “Is Google Data Studio free?”. Well, the answer is a resounding yes. Google Data Studio comes for $0, but only if you import data from Google platforms (Google Analytics, Sheets, BigQuery). In other words, Looker Studio has 24 free connectors that come without a fee, all of which are Google products.
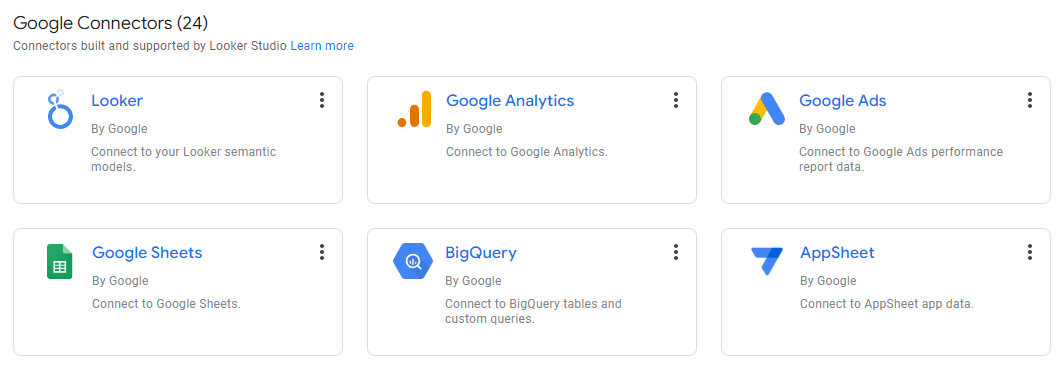
If you want to pool data from third-party sources, like Instagram ads, Facebook ads, WooCommerce KPIs, or Bing, you’ll have to opt for a monthly subscription fee for these paid connectors. However, the Looker studio cost for third-party data sources varies on the connector you choose, ranging between $20 and $350 monthly.
As a self-service subscription, Looker Studio Pro is the enhanced, paid version of Google Looker Studio. Designed for businesses and power users, the Pro version lets you use all the features of the free version on top of enterprise-level upgrades. Here’s what the paid version, Looker Studio Pro, is all about.
Looker Studio Pro allows businesses to retain control and management rights over their data sources and reports instead of delegating them to employees. This helps businesses maintain continuity and control over their assets even when employee X (or the HR head) leaves the company. The platform also allows you to set specific ownership permissions, allowing only authorized personnel to view and edit sensitive information.
In addition, when you subscribe to the Looker studio pricing model, you get access to a team workspace. These shared environments are where you and your team can work together on reports and data visualizations, facilitating streamlined operations. Team workspaces also support real-time collaboration, letting you share feedback, comment on reports, and edit visualizations with fellow employees on the go.

The paid version of Google Looker Studio boasts enhanced report delivery abilities, helping businesses keep their stakeholders informed with timely insights. By configuring reports to be sent daily, weekly, or monthly, scheduled delivery takes manual legwork out of the equation. This feature also helps you maintain a consistent check on your business operations by helping decision-makers make prompt, informed choices.
If you subscribe to the Looker Studio Pro model, you’ll receive reliable support services through the Google Cloud Customer Care team. Aiding companies with troubleshooting, complex reports and dashboards, and other technical challenges, this dedicated support minimizes downtime, helping you get back to making informed decisions.
So, when you consider the cost of a paid model, remember to weigh Looker Studio pricing against the potential benefits in terms of technical and administrative support.
Here are a few other features of Looker Studio Pro:
Looker Studio comes in both free and paid versions, catering to sole entrepreneurs, small businesses, and even multi-scale enterprises. The free version, Looker Studio, is better suited for SMEs and individual users as it possesses basic visualization and reporting features. Plus, if you rely entirely on Google’s suite of tools, this version is particularly beneficial for you.
Moving on, the paid version of Looker Studio Pro is designed for enterprise-level use. With advanced features like team workspaces, automated report delivery, content management with permissions, and technical support from Google Cloud Customer Care, Looker Studio Pro is all you need to make data-driven decisions for your business.
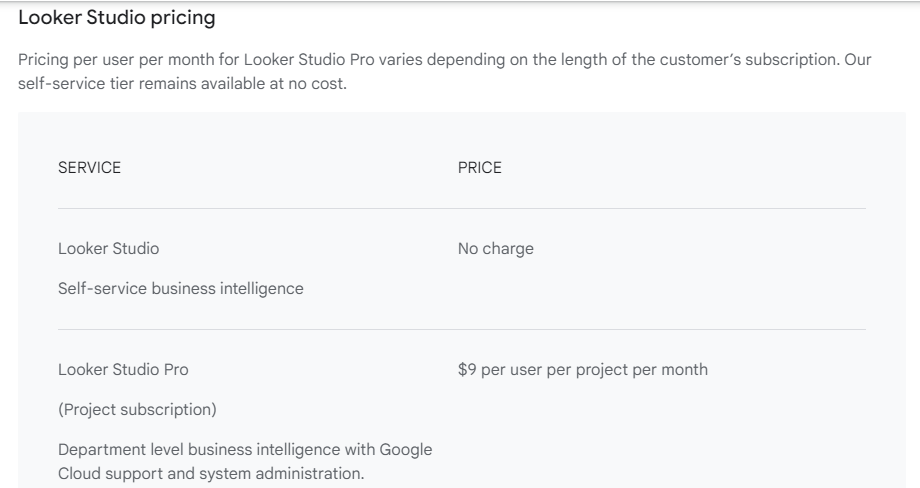
When it comes to Looker Studio pricing for the pro model, the platform starts at $9 per user per project per month for a basic plan. The pricing structure is divided into two components: the Looker license cost for individual users and the platform pricing. Plus, this subscription provides companies with Business Intelligence features at the department level, alongside support from Google Cloud and administrative tools.
Despite being a powerful tool for data visualization and analysis, Google Data Studio (now known as Looker Studio) has its downsides. Here are a few noticeable limitations of the platform:
Looker Studio allows you to blend up to five data sources, which might not be sufficient for businesses with multiple data streams.
Since Looker Studio relies on different APIs to fetch data, the platform may face delayed data processing and loading times (with large datasets).
The platform imposes limitations on visual customization, including only 50 charts on one page and 20 widgets per dashboard.
The MySQL connector in Looker Studio has a query limit of 150,000 rows, and exceeding this limit leads to data truncation.
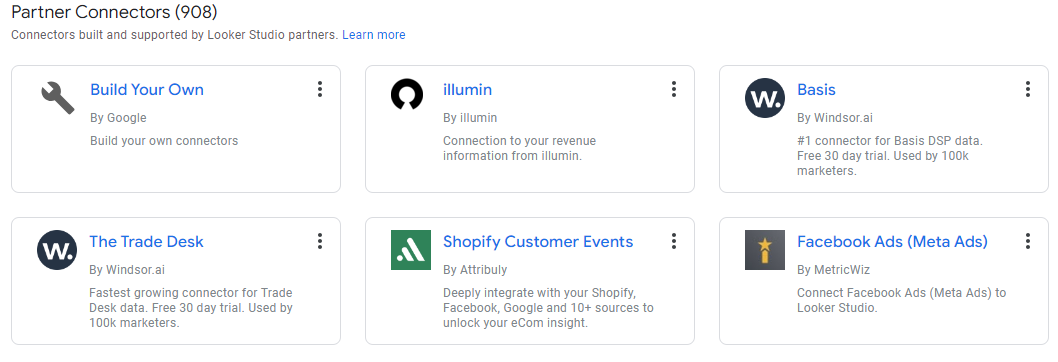
While Looker Studio is home to almost 908 connectors, third-party connectors come at an extra cost. This may increase the overall Looker Studio pricing.
When it comes to Looker Studio pricing, it’s clear that the platform is designed to cater to a wide user base, from sole entrepreneurs just starting out to multi-scale enterprises. The platform allows you to transform all your complex data sets into action-based, simple visualizations that are easy to digest. Looker Studio helps businesses make the right decisions at the right time, ensuring they get the most out of their marketing campaigns.
If you want more value out of your experience on Looker Studio, explore Catchr today. It facilitates a seamless flow of insights into Looker Studio by merging all your data sources, from social media metrics to CRM outputs and beyond. With its no-fuss, no-code approach, the tool simplifies the data integration process, making it easy for anyone to create real-time reports. This means you spend less time wrestling with data and more time drafting successful business strategies!