#1 - Create your first Data Source in Looker Studio.
In Looker Studio, there are two main entities :
Data Source
Report
A report allows you to display charts and tables with data contained in a data source.
We will see today how to create a data source in Looker Studio, and then, in the next course, we'll see how to create a report and add your data source.
To create a data source, you need to use a connector :
Connectors and data sources
Connectors
You can create a data source by using a connector. There is 2 type of connector :
Google Connector: Connectors built and supported by Looker Studio.
These are connectors for mostly Google tools, such as Google Ads, Google Sheets, Google Analytics, Youtube Analytics… but you can also find Amazon Redshift, Microsoft SQL Server, PostgreSQL, BigQuery…
There is 24 Google connector today, and these connectors are free to use.
Partner Connector: Connectors built and supported by Looker Studio Partners.
These connectors are for other tools like Facebook Ads, Microsoft Ads, LinkedIn Ads, TikTok Ads, TikTok Profile, and many more. They are developed by the community (like Catchr), and Google checks and validates them before making them visible in their store.
As of today (January 2023), there are 688 connectors developed by the community. The complete list of Catchr connectors is available here.
Data Source:
Data Sources are the gateway to your data. It is the connection between Looker Studio and the tools you need for the data.
To create one, click on Create → Data Source on the homepage, select a connector, pass through the different steps of authorization, and choose your account. There can be a bunch of options, don't worry, you can modify it later.
Click Connect.
Congrats, your data source has been created! You can find it in your data source list on the homepage.
You can start creating your report right now with this tutorial.
If you want to learn more about this page, here's more information :
Data Source configuration
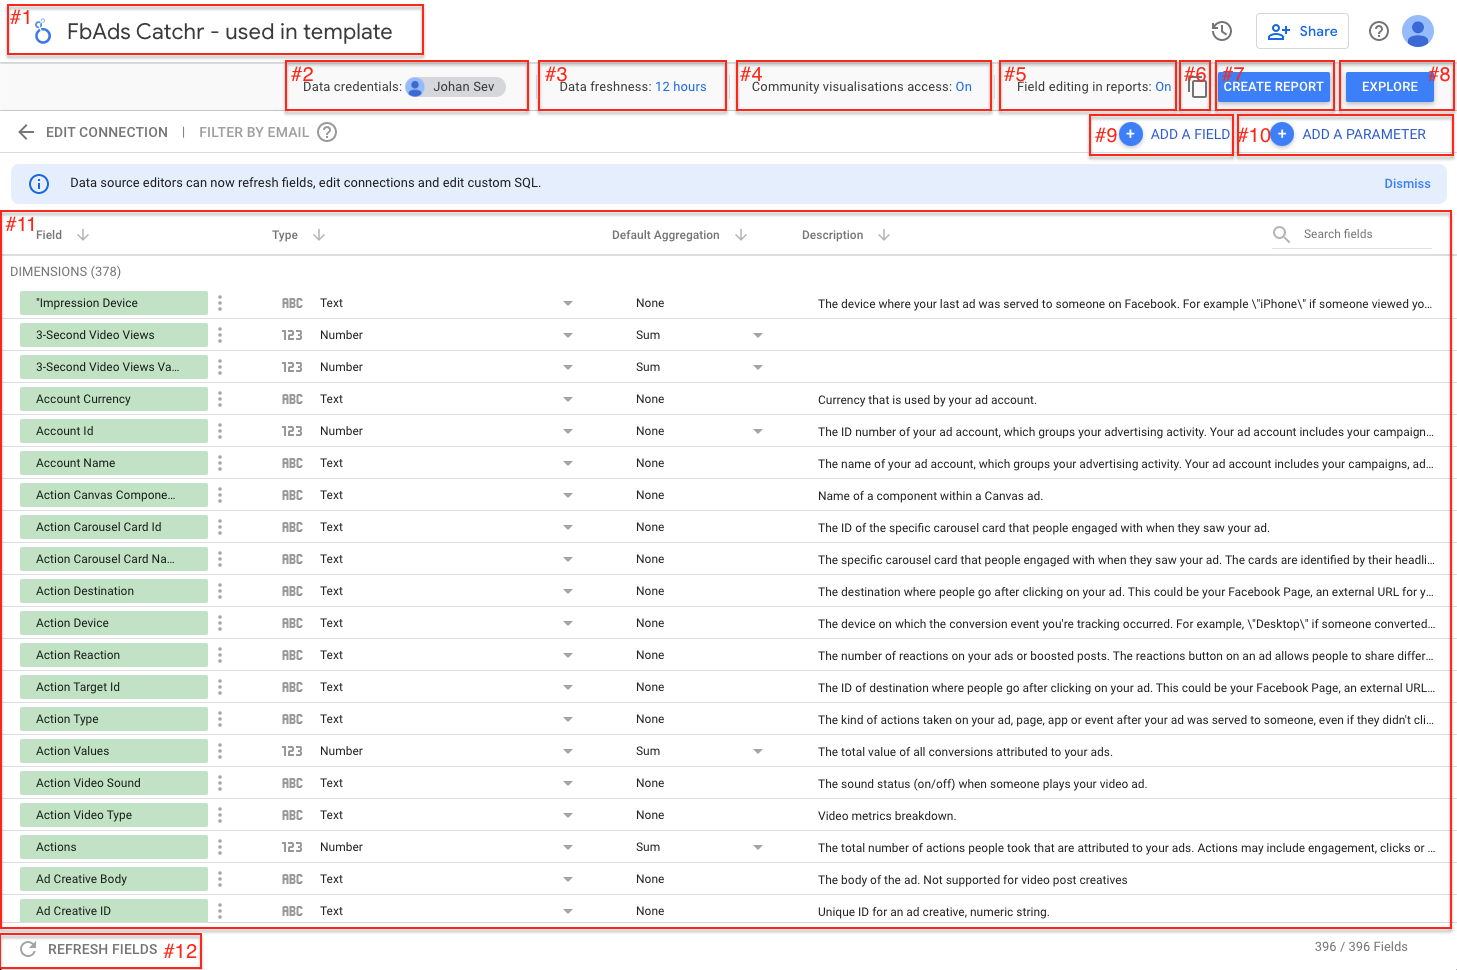
This is your data source page configuration :
You can configure a lot of things here:
Your Data Source Name #1
You can change the name just by clicking on it. It will be changed in every report this data source is used and in the data source list. You should always rename your data source in order to find them easily.
Data Credential #2
Data Credential: you can check which identifiers are used to access the data. You can also change this configuration to use the viewer's credential. That means every report viewer using this data source must have access to the tools linked to the data source.
Data Freshness #3
This indicates the rate of data refreshes. It is set by default to 12 hours, but a lot of connectors (Google and Partner) used a live connection. For example, all of Catchr's connectors have a live link; every time you refresh a report, you get new data.
Community Visualisations Access #4
Community Visualisations Access: you can disallow the editor of the report to use community visualization (special charts for your report). These are charts created by the community. If used when this option is not allowed, they will only show an error message. You must do that to prevent data transit through the community chart creator.
Enable field editing in report #5
Available by default, you can disable this options to prevent report editor to make any modification in type or aggregation method for this data source's fields.
Copy this data source #6
You can create an exact copy of your data source at any time. Any modification will be copied as well (new custom field, new name or type for existing field)
Create Report Button #7
Create a report: create a blank report containing these data sources.
Explore #8
Explore: create an explorer with this data source. It can be useful if you only need to search information through data and do not want to create a full report.
List of fields #9
Field: you can edit this field to rename a dimension or a metric.
Type: the type by default of the field. You can change it to specify a different type (for example, you can indicate a percent, an URL, or an Image).
Default Aggregation method: how this field is calculated if the aggregation method is necessary.
Description: This is the description of the fields. It contains more information on how to use them.
Add a custom field #10
Add a field: you can create custom fields easily with a custom formula. To know more about this, follow this link.
Add parameter #11
You can create a parameter to allow the viewer to play with your data (usually combined with a custom field). More information is available here.
Now that your data source is created, learn how to use it in a report in this tutorial !