This banner can be used to inform vistors of something important.
Learn more

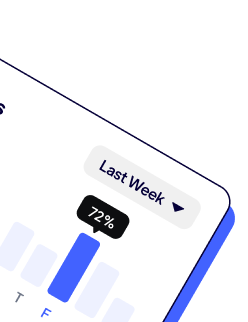
You can easiliy create a report following this step :
To start exporting your data to Google Sheets, you need to install the Catchr add-on. You currently have two options :
Option A: Via the marketplace:

Option B: Directly within a Google Sheets:

Once you have installed the add-on, you can start making requests.
Data-driven decisions are at the heart of running successful businesses and customer-oriented companies. Therefore, strong business intelligence tools like Looker Studio are an absolute necessity to create informative reports and get useful analytics in time. While the tool contains robust 800 data sources and 600 connectors, it still has some potential drawbacks.
From lagging interface to providing surface-level analysis, Looker Studio falls short in many critical aspects. In this guide, we will focus on the dark side of this tool, posing limits to numerous data-driven companies and business individuals.
Looker Studio, the self-service business intelligence tool transforms your data into compelling stories. It curates interactive reports and automated visual dashboards using shareable pie charts and graphs with a few clicks. You can even collaborate with your teammates in real time and derive vital insights to improve your digital marketing strategy over time.
According to Harvard Business School, business analytics drives more than 50% of financial performance in businesses. Looker Studio unlocks key insights to upgrade your business approach. See how it provides the ultimate features to align with your unique preferences.

Despite limitations, Looker Studio has a lot to offer for business individuals and social media analysts. It helps them make intelligent choices and more informed business decisions without having to write a single line of code. So, come along as we explore the benefits in more detail.
The conditional formatting in columns streamlines the color application to predefined data and numeric variables. It benefits most users in terms of data interpretation.
Looker Studio is HIPPA compliant, meaning it follows the physical security measures approved by the Health Insurance Portability and Accountability Act. Users can protect their data and integrate with numerous authentication networks for elevated safety.
The interactive charts, tables, and digestible visual reports by Looker Studio boost your joint team ventures. You can also annotate and leave comments on problematic data points to inform your team members about potential mistakes.
Interactive and easy-to-read reports are the top reasons for many to depend on Looker Studio. It lets you personalize these reports to meet your needs and get a quick introspection about your goals. Even better, you can use pre-made templates and mold your data the way you deem fit.
The Looker Studio community meets endless challenges when it comes to navigating the platform for reporting. Here, we will discuss the top 8 issues that, if addressed and fixed by Google, can make the BI tool the prime choice for many users. Let’s get started with Looker Studio limitations!
Under ideal circumstances, Looker Studio’s user interface could have been more responsive and manageable with massive datasets, but things are contrary. Many users complain of UI bugs and hiccups when running extensive projects, leading to slow progress and impeding workflow.
The custom design options and visual limitations are another sticking point in the UI. While it seems fine for non-technical people used to manual exporting and loading, the functions are quite flawed for someone aiming to try advanced formatting and dashboard preferences.
With data blending, you can merge data from different sources and gather it in one place for swift and sharp insights. Considering this, large-scale firms and business individuals need a similar data-blending option to manage gigantic files, but that’s where Looker Studio falls short.
Users can only blend data from five sources at a time otherwise the system starts lagging and taking the edge off productivity. Even worse, you can’t spot what led to errors in blended data (if any) because the system not only works under the hood but is a bit too technical and over-the-top for a lay user’s understanding.
The maximum number of rows available for data management refers to the Looker Studio row limit. As a rule of thumb, the more the number of rows, the more extensive amounts of data you can process. Besides showcasing the crucial figures, it helps users with loads of information at first glance.
Looker Studio compromises on this feature and limits the number of rows based on numerous conditions. For instance, the row limit in PDF and PNG formats is 500 which extends when the user chooses to display results in the web browser. It frustrates many users and leads to inaccurate data analysis due to limited input on the screen.
While pro customers depend on Google Cloud services for help, many free users complain of limited customer support access. The development team has long been under the spotlight for its sluggish response time when users encounter any technical or non-technical issues with the BI software.
Inadequate learning resources and a lack of online BI guides are also painstaking for someone getting a head start with this tool. It makes the learning curve steeper and more challenging than usual, causing them to shift their bias toward another business intelligence tool.
As a data integration tool, Looker Studio connects with GA4 to provide valuable business insights. However, users can make a limited number of data requests on a concurrent and hourly basis to connect with GA4 (quota limits per the 2022 update). Although it sounds like a minor inconvenience, users find it more time-consuming than ever to utilize this tool.
Because these quotas are not user-specific, simultaneous access attempts by multiple users can exhaust them faster, worsening the problem. So, enterprises that depend on Looker Studio for timely analytics and collaborative ventures can encounter growing inefficiency over time.
Looker Studio's data size limit is concerning, especially when you upload big datasets. It is clunky and falls dramatically low on performance with multiple data sets. Each user can upload files according to the restricted numbers set by Google and Looker Studio, which are as follows:

Business intelligence tools should be light on your pocket as not many can afford the skying prices for navigating the platform for a few hours. With that being said, Looker Studio is free to use only when you set it up and confine yourself to the Google platform. Fetching data from other platforms or switching to Pro can cost you an arm and a leg, especially if you are a starter.
Moreover, the overall pricing structure for pro users is intricate. It classifies your charges based on platform and licensing options. You have to buy an ownership license to access specific models, dashboards, data filtering, row-level details, and scheduling options.
Looker Studio terms these licenses as developer, standard, and viewer users based on the features you choose to access. The pricing options are categorized into standard, enterprise, and embedded editions according to the employee number and size of the organization.
While Looker Studio is sleek and simple for visual reports, users can acquire only so much information with its limited data analysis format. Besides providing limited real-time updates on the dashboard, the system restricts the number of charts one can employ to display the metrics.
It works like a deal breaker for mid-sized and larger enterprises, where the workload is ample and fresh, and updated data is required for informed decision-making.
Needless to say, Looker Studio is an excellent choice for simple and lightweight reporting. By screening the limitations, it is obvious why industry-level enterprises are reluctant to fall back on this tool for advanced analytics. However, a powerful visualization tool like Catchr can help you overcome these limitations.
It offers an affordable, no-code solution to streamline your data sources with Looker Studio and maximize its potential through deep analysis. Whether you want insights to build digital marketing reports or access real-time data to boost your KPIs, Catchr offers seamless features that cater to both — and even more.
So, sign up here to connect with Looker Studio and up your game in marketing with Catchr!